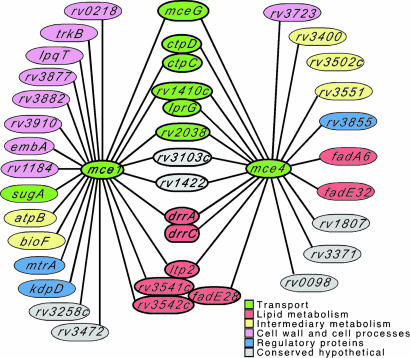
Fig. 3.
Genetic interaction map for the mce1 and mce4 loci. Graphic depiction of the identified positive interactions. Predicted suppressor mutations have been excluded, but are noted in Tables 3 and 4. Coloring indicates predicted functional classification (41). The “transport” category is predicated on data presented in this work. Tightly clustered ovals correspond to genes in single predicted transcriptional units.

