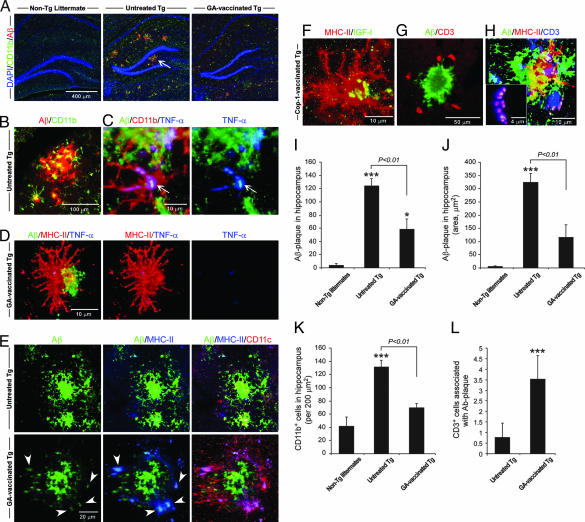
Fig. 2.
GA vaccination induces expression of CD11c by microglia and leads to a reduction in accumulation of Aβ in the brains of Tg-AD mice. (A) Representative confocal microscopic images of brain hippocampal slices from non-Tg, untreated Tg-AD, and GA-vaccinated Tg-AD mice stained for CD11b (activated microglia), human Aβ counterstained with nuclear DAPI. The non-Tg mouse shows no staining for human Aβ. The untreated Tg-AD mouse shows an abundance of extracellular Aβ plaques, whereas in the GA-treated Tg-AD mouse Aβ immunoreactivity is low. There is a high incidence of microglia double-stained for Aβ and CD11b in the CA1 and dentate gyrus regions of the hippocampus of an untreated Tg-AD mouse, but only a minor presence of CD11b+ microglia in the GA-vaccinated Tg-AD mouse. (B) High magnification of CD11b+ microglia associated with an Aβ plaque in an untreated Tg-AD mouse (arrow in A). (C) CD11b+ microglia, associated with an Aβ plaque, strongly expressing TNF-α in an untreated Tg-AD mouse. (D) Staining for MHC-II in GA-vaccinated Tg-AD mouse in an area that stained positively for Aβ shows a high incidence of MHC-II+ microglia and almost no TNF-α+ microglia. (E) All MHC-II+ microglia in a brain area that stained positively for Aβ (arrowheads) in a GA-vaccinated Tg-AD mouse coexpress CD11c, but only a few CD11c+/MHC-II+ microglia are seen in a corresponding area in the brain of an untreated Tg-AD mouse. (F) MHC-II+ microglia in a GA-vaccinated Tg-AD mouse coexpress IGF1. (G and H) CD3+ T cells are seen in close proximity to an Aβ plaque (G) and are associated with MHC-II+ microglia (H). The boxed area in H shows high magnification of an immunological synapse between a T cell (CD3+) and a microglial cell expressing MHC-II. (I) Histogram showing the total number of Aβ plaques (in a 30-μm hippocampal slice). (J) Histogram showing staining for Aβ immunoreactivity. Note the significant differences between GA-vaccinated Tg-AD and untreated Tg-AD mice, verifying the decreased presence of Aβ plaques in the vaccinated mice. (K) Histogram showing a marked reduction in cells stained for CD11b in the GA-vaccinated Tg-AD mice relative to untreated Tg-AD mice. Note the increase in CD11b+ microglia with age in the non-Tg littermates. (L) Histogram showing significantly more CD3+ cells associated with an Aβ plaque in GA-vaccinated Tg-AD mice than in untreated Tg-AD mice. Quantification of CD3+ cells was analyzed from 30–50 plaques of each mouse tested in this study. Error bars indicate means ± SEM. ∗, P < 0.05; ∗∗∗, P < 0.001 versus non-Tg littermates (Student’s t test). The P value represents a comparison by ANOVA. All of the mice in all groups were included in the analysis (six to eight sections per mouse).

