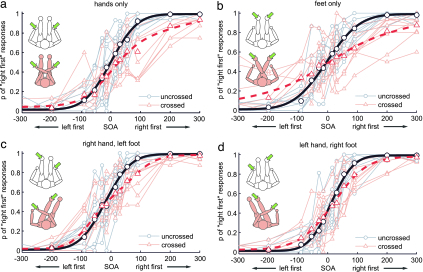
Fig. 1.
Response curves for TOJ right first (ordinates) of each participant plotted against stimulus onset asynchronies (abscissae) for the different limb combinations (Insets show body postures and stimulation sites). Negative values denote left-first stimulation. Gray/red small symbols and thin lines represent data from uncrossed/crossed conditions, respectively. Each dot represents the probability of right-first responses based on 12–16 judgments. Large symbols and thick-lined curves represent group average data and a group fit using the flip model as described (8). Participants sat in a chair with an arm rest and foot rest and responded with the effector they judged as having been stimulated first.

