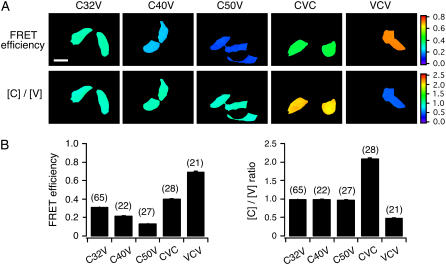
FIGURE 1 .
Validation of G and k factor. (A) Representative pseudocolor images illustrating FRET efficiency and Cerulean and Venus concentration ratio [C]/[V], in HeLa cells transfected with the fusion constructs as indicated. (B) Bar graphs summarizing the mean FRET efficiency (left) and the [C]/[V] ratio (right) for the indicated construct. Data are presented as mean ± SEM. The number of cells for each group is indicated in parentheses. Scale bar, 30 μm.

