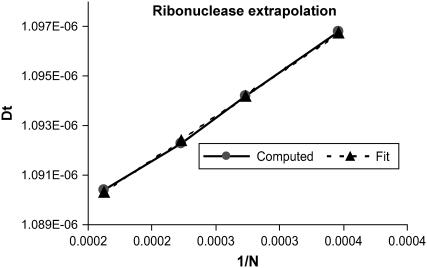
FIGURE 3.
Linear extrapolation of the trace of the translational diffusion tensor for ribonuclease versus 1/N. N varies between 2590 and 4950 triangles. A linear least-squares fit to the data (cm2/s) yields an intercept of 1.0832 10−6 (standard error = 2.6 10−10, Tstat = 4189), a slope of 3.50 10−5 (standard error = 8.7 10−7, Tstat = 40), and a variance of 1.38 10−20. Tstat is the T statistic indicating the appropriateness of a linear fit. The statistical error in the intercept is 0.024%.

