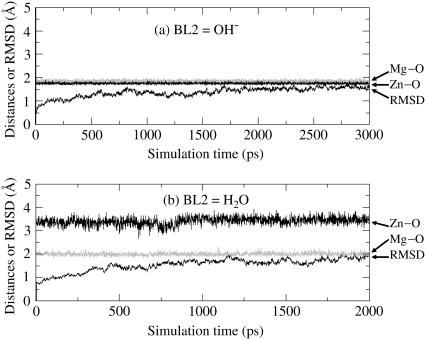
FIGURE 6.
Plots of the key internuclear distances (Å) versus the simulation time in the MD-simulated PDE5 structures. Zn-O refers to the distance between the Zn2+ ion and the BL2 (the second bridging ligand) oxygen. Mg-O represents the distance between the Mg2+ ion and the BL2 oxygen. RMSD represents the root mean-square deviation (Å) of the simulated positions of PDE5 backbone atoms from those in the initial structure. BL2 = HO− (a) or H2O (b).

