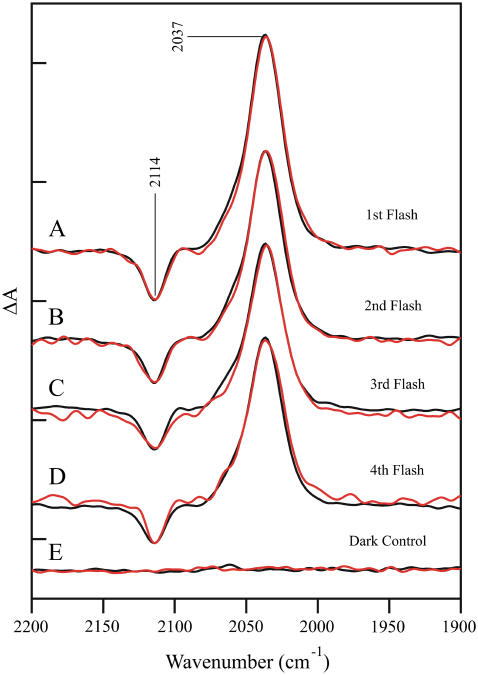
FIGURE 3.
Difference FT-IR spectra of calcium-containing (black traces) and strontium-exchanged (red traces) in the 2200–1900 cm−1 region. The spectra are associated with the S1′ to S2′ (A), S2′ to S3′ (B), S3′ to S0′ (C), and S0′ to S1′ (D) transitions. In E, a dark-minus-dark control is presented. The tick marks on the y axis are 2 × 10⁻⁴ absorbance units.

