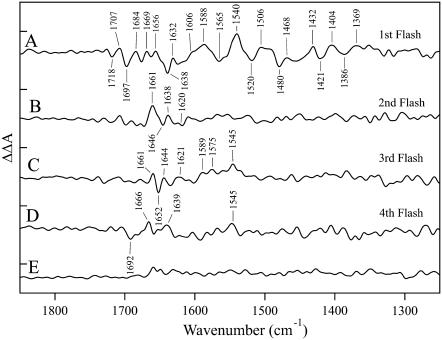
FIGURE 4.
Strontium-edited double difference spectra constructed from the data in Fig. 2 (calcium-minus-strontium) in the 1850–1250 cm−1 region. The spectra are associated with the S1′ to S2′ (A), S2′ to S3′ (B), S3′ to S0′ (C), and S0′ to S1′ (D) transitions. In E, a representative double difference control is presented in which no vibrational bands are expected. This control was constructed from the S2′ to S3′ data set by subtracting one half of the calcium data set from the other half, by subtracting one half of the strontium data set from the other half, and by averaging. The tick marks on the y axis are 1 × 10⁻⁴ absorbance units.

