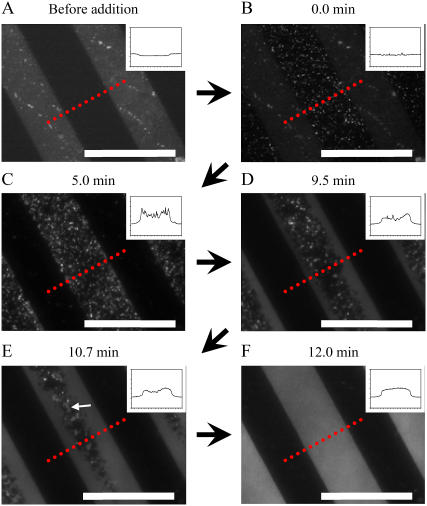
FIGURE 4.
TIR-FM images of the vesicle fusion process on a glass substrate with patterned DiynePC bilayer. Application of vesicle suspensions was conducted in two steps. A dilute suspension of egg-PC vesicles (0.1 μM) containing 30 mol % TR-DHPE was first added and incubated for 5 min. Subsequently, unlabeled egg-PC vesicles were added at a much higher concentration (100 μM). Formation of SPBs was visualized with the increased fluorescence intensity (dequenching) due to the mixing of labeled and unlabeled bilayers. (A) Image obtained before the addition of labeled vesicles. The bright stripes are patterned DiynePC bilayers. (B) Image obtained after the addition of egg-PC vesicles containing 30 mol % TR-DHPE. Vesicles adsorbed preferentially on the glass surface. (C–F) Images obtained after the addition of unlabeled vesicles: SPBs were formed preferentially at the boundaries of DiynePC bilayer and expanded toward the central region of lipid-free stripes (D and E) and fused some independent domains (marked by an arrow in E), finally covering the glass surface completely (F). The inset in each image is an intensity profile measured along the dotted line. The scale bars correspond to 40 μm. The elapsed time after the introduction of unlabeled vesicles is given at the top of each image.

