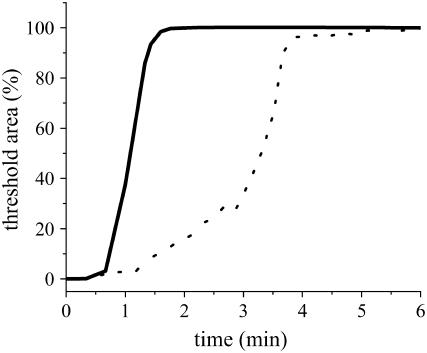
FIGURE 6.
Time course of SPB formation on patterned substrates (20-μm stripes) of DiynePC (solid line) and chromium (dotted line): The total area of SPB domains was determined for each fluorescence micrograph by calculating the area in which the fluorescence intensity exceeded a defined threshold. The data were normalized to the final area, where the observed regions were completely covered by SPBs and were plotted as a function of the elapsed time after the introduction of unlabeled vesicles.

