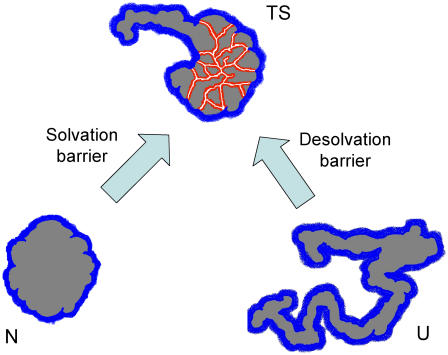
FIGURE 1 .
Pictorial illustration of desolvation/solvation barriers to protein folding/unfolding. The surface shown in blue in the native (N), unfolded (U), and transition (TS) states is exposed to the solvent. The surface shown in red in the transition state represents broken internal contacts, which are not solvated by water.

