Abstract
We investigated the effect of the charge and the hydrophobicity of drug delivery system (DDS) carriers on their specificity to living malignant melanoma B16F10 cells with the atomic force microscope. To model various nanoparticle DDS carriers, we used silica particles that were modified with silane coupling agents. We then measured the compression and decompression forces between the modified colloid probes and the living B16F10 cell in a physiological buffer as a function of their separation distances. The maximum adhesive force on decompression was related to the strength of the specificity of the DDS to the malignant cell. A comparison of the average maximum adhesive force of each functionality group surprisingly showed that negatively charged surfaces and hydrophobic modified surfaces all had similar low values. Additionally, we saw the unexpected result that there was no observable dependence on the degree of hydrophobicity of the probe surface to a B16F10 cell. Only the positively charged particle gave a strong adhesive force with the B16F10 cell. This indicated that DDS carriers with positive charges appeared to have the highest affinity for malignant melanoma cells and that the use of hydrophobic materials unexpectedly did not improve their affinity.
INTRODUCTION
Use of a drug delivery system (DDS) designed for malignant cells can minimize or eliminate drugs affecting noncancerous cells. Promising DDS carriers are multi-functional nanoparticles (1) or colloids/vesicles (2), as these can be designed to be specific to the cell in question. However, each organ type is made up of a different cell type, each having a unique surface property (3). Additionally, cancer cells differ from normal (nonmalignant) cells in that they reproduce in defiance of the normal restraints on division, acquire altered differentiated functions, and invade and colonize territories normally reserved for other cells (4,5). These mutated malignant cells may also cause changes in the cell genes (6). Thus, it is still unclear to which DDS functional groups a cancerous cell is most specific. People have been using the DDS without knowing its affinity to a malignant surface. To improve the success of the DDS, it is essential to obtain the fundamental data that tell us which DDS carrier surface functional groups show empathy to a malignant cell.
The surface properties of a malignant cell are still not well understood. However, the popular approach of screening an endless number of drugs and carrier types in the hope of finding a group specific to a malignant cell (7) is very inefficient and costly. Instead, using the knowledge of the structure of a cell, we may be able to better design a DDS. The amino acids in the receptors/kinases on a cell surface and the lipids in a cell membrane are composed of positive, negative, and hydrophobic groups (8). Highly hydrophobic molecules may therefore show better affinity to a cell than a less hydrophobic material because of the strong hydrophobic attraction with the hydrophobic constituents on the cell surface and those of the inner mitochondrial membrane system (9–13). However, because the surface of a cell is covered with a hydrophilic mucus network (14), the possibility of a hydrophobic bond forming is not known. Positively or negatively charged groups may also demonstrate affinity to a cell as a result of their bioadhesion with the charged groups of the receptors or kinases on the cell surface or with the negatively charged mucus network on the cell surface (14). Positively charged molecules have been reported to demonstrate toxicity to cells (15), suggesting their good affinity to cells. A malignant cell may have an overexpression or depletion of some receptors (16–20), but it is unclear which chemical groups are in excess and therefore should be targeted. We can obtain more information about which functionality groups bind best to a melanoma cell by testing the specificity of two fundamental chemical group types to a melanoma cell surface, that is, by investigating the effects of positive and negative charges and of the degree of hydrophobicity of the surface of a model DDS carrier particle. Such a systematic study does not appear to exist yet.
The atomic force microscope (AFM) has recently been applied to biological systems (21,22) and has been used to directly measure the adhesion force between a particle and a living cell (23,24). The interaction between a cell and a DDS carrier can be estimated with the AFM by using the colloid probe technique (25). If we attach to a cantilever a colloid particle that models a nanoparticle DDS carrier, we can directly measure the force between the colloid and a living cell as a function of their separation distance. The affinity of a carrier particle to a cell can be judged from the magnitude of the adhesion force in the decompression force curve, where a large adhesion force indicates a good specificity between the cell and the particle. The functionality of the model DDS particle can be established by modifying silica particles with silane coupling agents (26).
In this study, we investigated which fundamental functionality groups show affinity to malignant cells by measuring with the AFM the adhesion between functionalized cantilever colloid probes and a living malignant melanoma B16F10 cell in a physiological buffer solution. Concretely, we tested the effect of the charge and hydrophobicity of the surface of a particle to the B16F10 cell. Here we chose to use the malignant melanoma because it metastasizes widely and therefore is one of the most dangerous cancers (27).
EXPERIMENTAL
Materials and methods
Preparation of functionalized colloid probes
The following silane coupling agents were used to functionalize the surface of silica particles (D = 6.84 μm, Bangs Laboratories, Fishers, IN): trimethoxy(methyl)silane (Tokyo Kasai, Tokyo, Japan), trimethoxy-n-propylsilane (Tokyo Kasai), n-hexyltrimethoxysilane (Tokyo Kasai), octadecyltrimethoxysilane (Tokyo Kasai), and N-trimethylsilylpropyl-N,N,N-trimethylammonium chloride (50% in methanol, Gelest, Morrisville, PA).
In the case of all the silane coupling agents except N-trimethylsilylpropyl-N,N,N-trimethylammonium chloride, the silica particles were functionalized by the method of Ohno and others (28). Briefly, 20 μl of the silica particles in water dispersion was added to 3 ml of an ethanol (99.5% EtOH, highest purity, Kishida Chemicals, Osaka, Japan) ammonium mixture (highest purity, Kishida Chemicals) (12.6 EtOH:1 NH3) and was stirred for 2 h at 40°C. A solution consisting of 0.2 g of the hydrophobizing agent and 1 ml EtOH was then added dropwise and allowed to stir for a minimum of 18 h at 40°C. The particles were then washed a minimum of three times in solvent by centifugation and decantation. The final particles were subsequently dispersed in ethanol or, in the case of n-hexyltrimethoxysilane and octadecyltrimethoxysilane, in heptane (highest purity, Kishida Chemicals). The high hydrophobicity of the n-hexyltrimethoxysilane- and octadecyltrimethoxysilane-modified particles inhibited their dispersion in ethanol. All samples were subsequently stored in clean vessels.
The colloid probes of the above particles were prepared by evaporating the solvent from a small volume of the particles and then attaching a single particle to a gold-plated Si-Ni4 cantilever (spring constant = 0.06 Nm−1, NP-S, Veeco (Osaka, Japan) NanoProbe Tips,), which had been cleaned by water plasma treatment, by using an XYZ micromanipulator and an epoxy resin (Japan Epoxy Resin, Tokyo, Japan). The reason for modifying only the particle and not the whole cantilever was to allow the highest degree of cleanliness. In the case of the hydrophobic surfaces, it was also important to eliminate other unnecessary hydrophobic surfaces because nanoscopic bubbles can form on highly hydrophobic surfaces in an aqueous solution (29–31), leading to the possibility of artifacts in the force data.
In the case of N-trimethylsilylpropyl-N,N,N-trimethylammonium chloride, the bare silica particle was first attached to a cantilever, which was then cleaned by plasma treatment. The colloid probe was then modified by adding a solution containing 0.2 g of the hydrophobizing agent and 1 ml H2O and allowing it to react a minimum of 18 h. The cantilever was then washed with water several times before use to remove the excess of the hydrophobizing agent. This alternate method was used because the high positive charge of the modified particle meant the particle needed to be kept in an aqueous environment. If the particle was dried, then the surface properties appeared to change. In the case of a bare silica probe, a silica particle was attached to a cantilever, and then the colloid probe was cleaned by water plasma treatment.
Other materials
The water used this experiment was distilled and deionized to give a conductance of 18.2 MΩ cm−1 and a total organic content of 5 ppm. Mica was used to test the modification of the particles.
Cells
General cell culture
The malignant cell line B16F10 (mouse skin cancer cells, obtained from the laboratory of Prof. Fukumori of Kobe University) was cultured in MEM medium (Eagle's MEM medium with kanamycin, without sodium bicarbonate, l-glutamine, Nissui Pharmaceutical, Tokyo, Japan), supplemented with l-glutamine (Nakalai Tesque,) and fetal bovine serum (FBS, JRH Biosciences). The medium was sterile filtered, and the pH adjusted to 7.4 using sodium hydrogen carbonate (Nacalai Tesque). The subculture of these anchorage-dependent cells required the growth of the cells on a rigid surface and the stationary incubation of these surfaces. Before a new 75-cm2 culture flask (Iwaki, 3110-075X) could be seeded with cells, the flask to subculture was first washed with a buffer solution (Dulbecco's Phosphate-Buffered Saline without calcium chloride or magnesium chloride, PBS, Gibco, Grand Island, NY). The cells were subsequently removed from the substrate by use of trypsin (trypsin from hog pancreas, Nakalai Tesque). A complete media solution (MEM solution containing FBS) was then added to the cells plus trypsin solution, giving a cell concentration of 5 × 10⁵ cell ml−1. This cell suspension was then filled 2 mm high in either a cell culture flask or a 40-mm cell culture dish (Iwaki, 3000-035x); the flask was used when the purpose was successive subculture, and the dish for the AFM experiment samples. The samples were stored in an incubator, which maintained an atmosphere of 5.0% CO2, and at a temperature of 37.0°C. This ensured the pH of the complete media solution was 7.4; this is the physiological pH.
Culture of cells on glass slides
Glass slides (Micro Slide Glass, Matsunami, Osaka, Japan) were cut as 1.5 × 1.5 cm2 squares and functionalized as in the preceding section. The cells were then cultured on these slides as described above. However, in this case, the substrates were placed inside the cell culture flasks, and the cell solution was added.
The adhesivity of the dead cells on the functionalized substrates was investigated by killing the cells that were cultured in the above way. Briefly, the glass substrates were washed with a buffer solution, allowed to dry for ∼15 min, and then covered again with the complete medium solution. Testing with Trypan blue (Nacalai Tesque), which stains dead cells blue, showed that the cells were indeed killed in this method.
AFM sample preparation
The AFM culture dishes were allowed to grow for 1 day in the incubator, giving a monolayer of cells (logarithmic growth phase). To maintain the solution pH of the culture dish at 7.4 for several hours in the outside environment, i.e., the same pH as was obtained within the incubator, the subculture complete medium solution was replaced with 1 ml L-15 (Leibovitz's L-15 Medium with l-glutamine, L-15, Gibco) after washing the dish with PBS. No FBS was included in the L-15, which eliminated the effect of those polymers on the experimental results.
Instruments and measurements
Surface force measurement technique
The surface forces between a cell and colloid probe in the L-15 solution were measured at room temperature (28 ± 1°C) as a function of their distance using an AFM (MFP-3D, Asylum Research, Santa Barbara, CA). Briefly, the transparent 40-mm cell culture dish was placed on the AFM stage (the x-y piezo). The cells, which were on the inside bottom of the culture dish, could be viewed by a light microscope, which was positioned below the AFM stage. The cantilever with the functionalized probe was fixed on the AFM head (the z-scanner), positioned to face the cells.
The method of Ducker and others (25) was used for the force measurements. Briefly, the colloid probe cantilever was brought in contact with the cell of interest at a speed of 1 μm s−1 and the loading force needed to cause the probe to enter the cell ∼500 nm. This value ensured the cell surface was reached, gave a compliance region, and was low enough not to damage the cell irreversibly (32). During this time the compression force data were collected. Once in contact, the probe was left on the cell surface for 10 min. This long time was used because we wanted to compare the specificity of various probe functionality types, which we thought might have shown only a small difference. This result was based on a previous study in which we showed that the adhesion between a particle and a living B16F10 cell increased with the period of probe contact at the cell surface (32). This long time also gave a relevant model for the drug release process, which uses long circulation times of the DDS carrier in the bloodstream to increase a drug's accumulation in the tumor cells and tissues (33).
After this contact time of the probe at the cell surface, the probe was moved away from the cell surface, and the data for the decompression force curve collected. The change in the deflection of the cantilever (Δx) was measured as a function of the piezo displacement, using the differential intensity of the reflection of the laser beam off the cantilever onto a split photodiode. The force (F) could then be calculated from Hooke's law, F = kΔx, where k is the spring constant of the cantilever.
The constant compliance region in the force curves may be taken in the region just after the probe was in contact with the surface of a cell, where there was a linear relation between the measured separation distance and deflection distance (Δx) (34). In doing this, we presumed that the deflection of the cantilever was caused only by the elastic deformation of the cell (35–37). Zero separation was subsequently characterized from the position of the onset of the linear compliance region in the force profile.
The zero-force position between the surfaces was defined from the baseline of no deflection of the probe cantilever. In the case of the compression force curves, this was at large probe–substrate separations. In the case of the decompression force curves, the cell and the probe did not always separate completely. Additionally, the long contact time of the particle at the cell surface before measurement of the decompression force meant we could not ignore the possibility that the z-piezo may have experienced a small drift during the time of waiting at the cell surface. Thus, to ensure that the measured decompression force data contained no such instrumental effects, we measured another compression force curve immediately after measuring the decompression force curve. The baseline of this additional compression force curve was used to define the zero-force position for the decompression force curve, thereby removing any artifacts caused by that drift and an incomplete separation between the cell and probe, if present.
Throughout the AFM experiment, the cells were monitored with a light microscope. Additionally, each cantilever with an attached probe was used to measure only a maximum of three force curves. If the same cantilever was used to measure more force curves, the probe was sometimes seen to be contaminated. Each force measurement was made at the nucleus of a different cell, as it was the highest point in the cell and so gave a definable and repeatable measuring position (38). The forces corresponding to each functionalized probe type were measured a minimum of 20 times (force data from seven different colloid probe cantilevers and therefore a minimum of 20 different cells).
Other methods
The contact angles of the hydrophobized surfaces were measured by the sessile drop method. The isotherms for the adsorption of the hydrophobizing silane coupling agents were obtained by measuring the contact angles of the modified glass substrates using different concentrations of the silane coupling agents. Here, the modification of the glass substrates was carried out in the same way as described above but by using various concentrations of the silane coupling agents.
RESULTS AND DISCUSSION
Functionalization of the silica probe surfaces and their characterizations
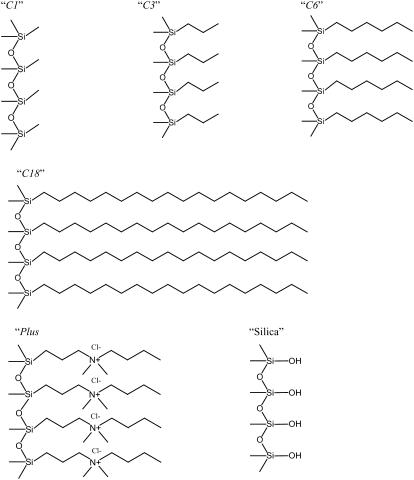
A silica surface can be modified relatively easily to give various functionalities by using silane coupling agents. Thus, by using silica colloids and the appropriate silane coupling agents, we could obtain particles with a hydrophobic and a positively charged surface. We obtained surfaces of increasing hydrophobicity by using trimethoxy(methyl)silane (C1), trimethoxy-n-propylsilane (C3), n-hexyltrimethoxysilane (C6), and octadecyltrimethoxysilane (C18). The positively charged surfaces were obtained by using an N-trimethylsilylpropyl-N,N,N-trimethylammonium chloride–modified particle (Plus). A negatively charged surface was obtained by using a bare silica particle. Fig. 1 shows a schematic picture of the surface functionalities of the various particle types.
FIGURE 1.
A schematic picture depicting the surface of the modified particles. C1, C3, C6, C18, and Plus refer to silica surfaces modified by trimethoxy(methyl)silane, trimethoxy-n-propylsilane, n-hexyltrimethoxysilane, octadecyltrimethoxysilane, and N-trimethylsilylpropyl-N,N,N-trimethylammonium chloride, respectively. Silica shows the surface groups on a silica particle.
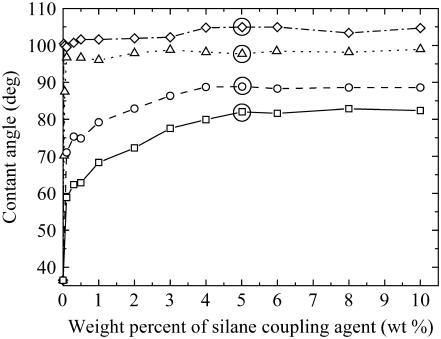
We could determine the experimental conditions to modify the particles with the silane coupling agents and determine their adsorbed state by measuring the contact angles of the surfaces modified with the hydrophobic silane coupling agents, i.e., C1, C3, C6, and C18. However, because it is difficult to measure the contact angle of such small particles (39), we instead functionalized glass substrates, which also have surface silanol groups, and measured their contact angles by using the sessile drop method (39). Fig. 2 shows the contact angles of glass substrates functionalized by the method described in the experimental section, when various different concentrations of silane coupling agents were used. A plateau in the contact angle versus concentration data indicated a maximum adsorption of the silane coupling agents to the glass substrate. The facts that ∼4 wt % silane coupling agent was required for the maximum adsorption for each of C1, C3, C6, and C18 and that each of these silane coupling agents had the same Si-(OCH3)3 end group that reacted with the glass/silica silanol groups suggested that the maximum adsorption of such Si-(OCH3)3 end-grouped silane coupling agents occurred at ∼4 wt % under these conditions. The contact angles of the surfaces with the maximum adsorption of C1, C3, C6, and C18 also gave contact angles in good correspondence with those reported by others (40,41). Thus, because Plus also had the same -Si-(OCH3)3 end group as the hydrophobizing silane coupling agents, we could assume that the same adsorbing conditions for C1, C3, C6, and C18 could be applied to Plus. Therefore, in the force experiments with the cells, we used a concentration of ∼5 wt % silane coupling agent to functionalize the silica particles; this concentration should ensure a maximum adsorption of the silica particles.
FIGURE 2.
The change in the contact angle of a glass substrate as a function of the concentration of silane coupling agents when functionalized in the method given in the experimental section. Here the different silane coupling agents are depicted as C1 (□ with solid line); C3 (○ with dashed line); C6 (Δ with dotted line); and C18 (◊ with dashed-dotted line). The maximum adsorption of the silane coupling agents commences at the horizontal plateau in the contact angle versus concentration data. A solid circle is drawn around the concentrations used to functionalize the silica particles.
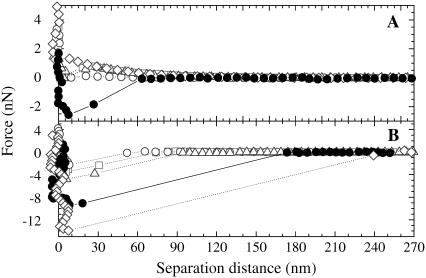
It was necessary to verify that the particle surfaces were indeed modified with the silane coupling agents before we used them in the force measurements with the cell. The fact that the silica spheres modified with C6 and C18 did not disperse in ethanol but could disperse in heptane gave evidence that the particles were well modified. The high hydrophobicity of the C18 presumably inhibited their dispersion in highly hydrophilic media such as water or ethanol. Further verification of the modification of the silica particles to give C1, C3, C6, C18, and Plus surfaces could be obtained by measuring the forces in water at pH 5.6 (the pH of the water we used) between the functionalized silica particles and a freshly cleaved mica plate, which is negatively charged under these conditions ((42); Fig. 3). In the case of the C1-, C3-, C6-, and C18-modified particles, a van der Waals force was observed in the compression force curve, and a single adhesion peak was measured in the decompression force curve. In the case of a bare silica particle, which is strongly negatively charged in pH 5.6 water, a strong electrostatic force is present on compression against a mica substrate (42). The absence of the electrostatic repulsion in the case of these functionalized probes showed that there were no significant bare silica areas present on the modified particles. This indicated a good modification of the silica particles with these silane coupling agents. In addition, the absence of many small adhesion peaks in the decompression force curves indicated that there was little or no contamination on the modified colloid probe and that there were no microbubbles attached. If a microbubble were attached, we would expect to see many discontinuous steps in the adhesion force in the decompression force curve (43,44). In the case of the Plus-modified particle, we observed a long-range attraction to ∼60 nm in the compression force curve. Such a long-ranged attraction is expected between two oppositely charged surfaces in an aqueous solution (45), such as a system comprising a particle that was modified to give a positive charge and a negatively charged mica substrate surface. The fact that we did not measure the strong repulsive electrostatic force characteristic of a negatively charged silica surface and negatively charged mica surface system indicated that our surface had been modified to be positively charged with Plus. The presence of only one adhesion peak in the decompression force curve for Plus showed the smoothness and absence of contamination on the surface of the colloid probe. These facts show a good modification of the silica particle surface with all the silane coupling agents.
FIGURE 3.
The forces between the functionalized silica particles and a freshly cleaved, mica plate in water of pH 5.6. Here, we used C1- (□ with dotted line), C3- (○ with dotted line), C6- (Δ with dotted line), C18- (◊ with dotted line), and Plus-modified (• with solid line) silica particles. Panels A and B show the compression and decompression forces, respectively.
Forces between probe and cell
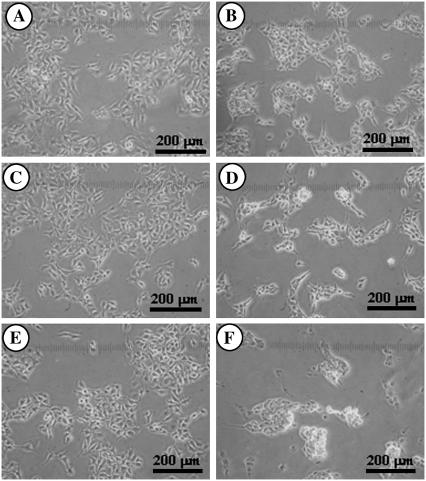
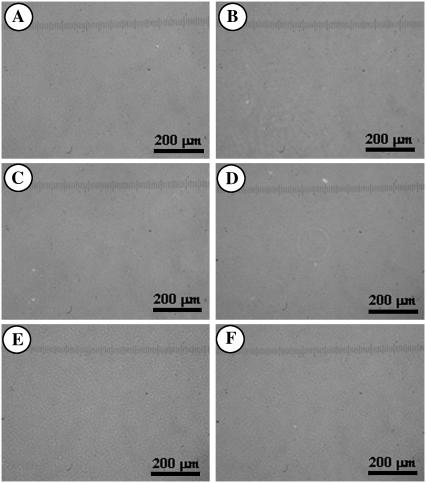
The specificity between B16F10 cells and the functionalized surfaces was first investigated using light microscopy by measuring the adsorbability of the cells to the surfaces. The images of both living and dead B16F10 cells were taken, so that we could also judge the difference in the adhesivity between living melanoma cells and dead cells. Force measurements between a dead cell and a particle were not possible, as dead B16F10 cells did not adhere to the cell culture dish, which is a prerequisite in this force measurement technique. Figs. 4 and 5 show the living and dead B16F10 cells, respectively, on glass slides whose surfaces were functionalized to give a model silica surface (bare glass; (Figs. 4 A and 5 A) and Plus (Figs. 4 B and 5 B), C1 (Figs. 4 C and 5 C), C3 (Figs. 4 D and 5 D), C6 (Figs. 4 E and 5 E), and C18 surfaces (Figs. 4 F and 5 F). The figures show that living cells adsorbed on all the surface types, whereas the dead cells did not adsorb to any surfaces. Therefore, only living B16F10 cells showed specificity to each surface type. However, because we could not easily judge which surface type showed most affinity to a living B16F10 cell using only light microscopy, we used the AFM to measure the forces between living B16F10 cells and the functionalized probes.
FIGURE 4.
Light microscope image of living B16F10 cells adsorbed at bare and functionalized glass substrates. Panels A, B, C, D, E, and F show the glass (model for silica), Plus, C1, C3, C6, and C18 surfaces, respectively.
FIGURE 5.
Light microscope image of dead B16F10 cells adsorbed at bare and functionalized glass substrates. Panels A, B, C, D, E, and F show the glass (model for silica), Plus, C1, C3, C6, and C18 surfaces, respectively.
Before each set of AFM force measurements between the functionalized probe and cell, the good surface modification of each colloid probe cantilever with the silane coupling agents was verified by measuring the forces between the colloid probe and a mica sheet and in the presence of water. If forces characteristic of the functionalized probes were obtained, i.e., similar to those shown in Fig. 3, then these probes were used to measure the forces between the cells. The clean negatively charged surface (bare silica colloid probe) was verified by measuring its force in water against a freshly cleaved mica surface. If a strongly repulsive force similar to that from Hartley and others (42) was measured, then this probe was used in the cell force studies.
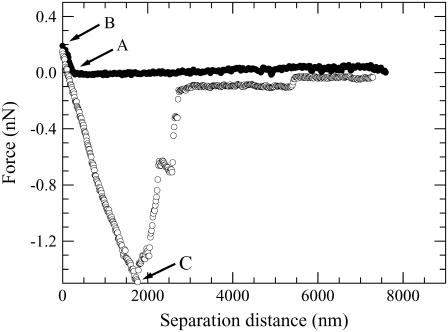
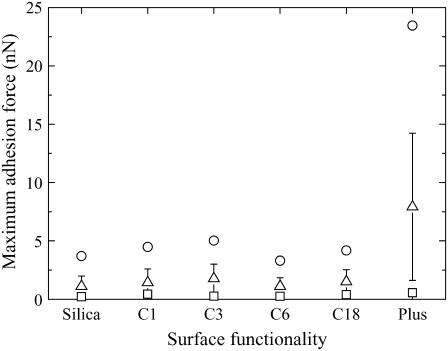
The effect of a negatively charged particle on the strength of the adhesion to a malignant cell was determined by measuring the force between a bare silica particle and a B16F10 cell. A minimum of 20 force curves were measured at the nucleus of different cells. Each force curve showed similar features; Fig. 6 gives an example of one such force. No repulsion or attraction was seen in the force curve up to point A, which was shown in a previous article to be the surface of the cell when we measure in the L-15 solution (32), as we did here. As we continued to compress the two surfaces, we saw a repulsion. This was presumably a steric or viscoelastic repulsion resulting from the compressibility of the cell by the silica particle. This is plausible because cells are reported to be viscoelastic (46). This short-ranged repulsive force indicates that the particle did not enter the cell but resided on its surface during the contact time of 10 min (see point B); a long-ranged repulsive force would have suggested the particle did not reach the cell surface, and an attraction would have suggested the particle entered the cell. The decompression force was measured after the contact time of 10 min. An adhesion force was measured, the strength of which was given by the maximum in the adhesion force (Fadmax, point C). A strong maximum suggests the rupture of an adhesive junction containing many links in parallel (47), so it was thought that most of the contact points between the cell and silica probe were broken at this point. At further separation distances, we saw some smaller adhesion maxima before the two surfaces separated completely. These smaller adhesions are probably tether points left by the breaking of ligand–receptor bonds or the breaking of nonspecific bonds. These bonds may have reformed after being broken at Fadmax, as the cell and particle had not yet completely separated (47). The probability of these long-ranged tether points resulting from material from the cell attaching to the probe is low because the successive compression force was identical to the previous one, i.e., the one shown in the figure. The average of the adhesion maxima (〈Fadmax〉) was 1.112 nN, the standard deviation (std) was 0.865 nN, and the maximum (max) and minimum (min) of all the measured Fadmax values were 3.698 and 0.211 nN, respectively. These nonzero Fadmax values showed that the negatively charged silanol groups on the silica particle must probably be either electrostatically binding with positively charged groups on the cell surface or hydrogen bonding with such possible sites on the cell surface; i.e., the particle is probably undergoing nonspecific forces with the cell surface. The possibility of the silica silanol groups participating in specific interactions with ligands or receptors on the cell surface can, however, not be ignored. The fact that std was not zero also showed that this binding strength was characteristic of the particular cell being measured.
FIGURE 6.
An example of a force curve measured between a bare silica particle (negative charge) and a B16F10 cell in the L-15 solution. The decompression force curve was measured after the particle resided at the cell surface for 10 min. Points A, B, and C depict the surface of the cell, the position relative to the cell surface where the particle resided for 10 min, and the maximum adhesion force, respectively.
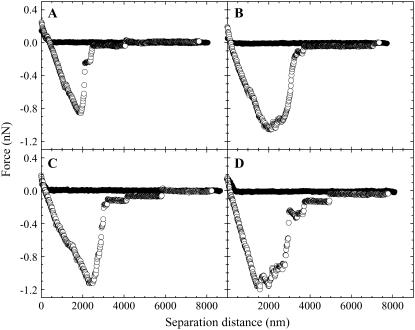
The effect of the hydrophobicity of the colloid probe on the adhesive strength to a malignant cell was measured by using silica probes functionalized with C1, C3, C6, and C18. Properties inherent only to hydrophobic surfaces are thought to appear for surfaces with a contact angle greater than 90° (48). Thus, as C18 has a contact angle greater than 90°, it was imagined that the adhesion force for C18 would be greater than that for C1 if there were a significant number of hydrophobic areas on the B16F10 cell surface or if the probe could enter the cell by facilitated diffusion. Examples of the forces obtained between C1-, C3-, C6-, and C18-modified colloid probes and a B16F10 cell are shown in Fig. 7, A–D, respectively. In each of the cases, we detected no adhesive or repulsive force in the compression force curve until the surface of the cell was reached, at which point a steric repulsion was measured. This short-ranged repulsion and the absence of an adhesion at short separation distances indicated that the C1, C3, C6, and C18 functionalized particles did not enter the cell but only resided at the cell surface during the cell-probe contact time of 10 min. The decompression force curves displayed a large adhesion, whose maximum was determined as the adhesion maximum, and several smaller maxima at larger separations. Again, the maxima in the adhesion forces occurred where the contacts between the cell and the probe ruptured. Because the successive compression force curves were identical to the previous compression force curves for C1, C3, C6, and C18, the smaller adhesions at larger separations were probably tether points and not places where the particle removed material from the cell surface. These adhesions may have been caused by either the rupture of newly reformed bonds or bonds not yet broken, as the particle and the cell were not completely separated at this point. The 〈Fadmax〉 ± std values for C1, C3, C6, and C18 were 1.433 ± 1.160, 1.768 ± 1.237, 1.111 ± 0.731, and 1.503 ± 1.028 nN, respectively. Considering the standard deviation of the measurements, there appeared to be no dependence of the hydrophobic chain length, and therefore of the degree of hydrophobicity, on the strength of the adhesion force to a malignant cell. This result is in opposition to that shown by Ong and others (37), who used AFM compression force curves to show that the adhesion between cantilevers modified with Escherichia cells and various substrates increased in the order of mica polystyrene Teflon substrates. The corresponding contact angles of these substrates were given to be 0°, 74.3°, and 110.6°, respectively. The differences in the results between our and their data may be that in the study of Ong and others both the degree of hydrophobicity and the surface functionality were changed. In our study, we kept the surface structure and therefore functionality unchanged and changed only the surface hydrophobicity by increasing the hydrocarbon chain length of the surface molecules. This difference in the adhesion strength may therefore be inherent in the different chemical functionalities.
FIGURE 7.
Examples of the forces obtained between (A) C1-, (B) C3-, (C) C6-, and (D) C18-modified colloid probes and a B16F10 cell in the L-15 solution. The decompression force curve was measured after the particle resided at the cell surface for 10 min.
The lack of dependence of hydrophobicity of our model DDS particle on the affinity to the B16F10 cell showed that there was no strong hydrophobic bond occurring; a highly hydrophobic molecule, such as C18, should have bound more strongly to hydrophobic regions than a weakly hydrophobic molecule such as C1. Therefore, the hydrophobic molecules on the model DDS carrier may have been prohibited from passing through the cell membrane to the hydrophobic inner cell regions and thus must have bound only with the small hydrophobic portions of the amino acids on the cell surface. Alternatively, the cell interior may have been more hydrophilic than hydrophobic, resulting in no significant hydrophobic interaction with the hydrophobic model DDS particle. Although we observed no measurable chain-length dependence on the Fadmax, the nonzero adhesion forces in our measurements indicated that there was some bonding occurring between the hydrophobized model DDS carrier particle surface and the malignant cell. The origins of these adhesions may have been nonspecific forces such as the van der Waals force or a weak hydrophobic bonding with the hydrophobic cell membrane or hydrophobic regions in the receptors or kinases on the cell surface. The weak hydrophobic bonding may be a consequence of the cell membrane being covered by the hydrophilic negatively charged layer that resides on a cell surface (14).
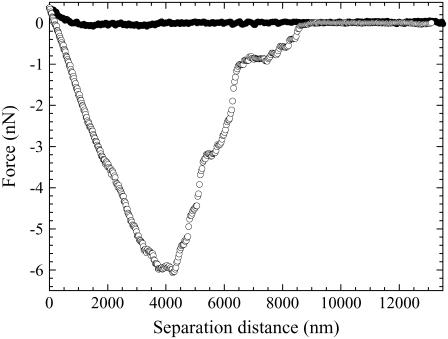
The interaction between a positively charged particle and the B16F10 cell was measured by using silica particles modified with Plus; an example of one such force curve is shown in Fig. 8. No attractive or repulsive force was observed in the compression force curve until the surface of the cell was reached, on which a steric repulsion was measured. Again, the presence of this short-ranged steric force and the absence of an adhesive force at short separations in the compression force curve indicated that the Plus-modified particle probably did not enter the cell but resided only at the cell surface. After contact with the cell surface for 10 min, the decompression force curves displayed a large adhesion, Fadmax, at a relatively large separation. This indicated that the adhesion between the cell and the Plus-modified particle was very strong and difficult to break. This adhesion maximum is probably where the bonds in parallel were broken. Two kinks were almost always seen on the adhesion maximum. These may be due to the unfolding and extension of a macromolecule, such as a protein, on the cell surface (49) or the breaking of multiple bonds in series (50). A large std of 6.306 nN was also observed in the values of Fadmax when data from numerous B16F10 cells were compared. This large deviation in the results shows that the adhesion strength is inherent to the individual cells. This appears to be a property coherent of malignant cells, as, for example, the number of mutant functional groups (e.g., onocogenes or tumor suppressor genes) in a cell increases as a tumor develops from being benign to malignant (51). Smaller adhesions were observed at larger separations. Because the successive compression force measured at the same position was the same as the previous compression force curve, the cause of these adhesions is probably the rupture of bonds and not the removal of cell material by the particle. The bonds being ruptured may either be bonds that require more energy to break than those at the separation distance for Fadmax or bonds that reformed after being broken once at Fadmax. The latter is possible for links in parallel and when the cell and particle are not completely separated. The 〈Fadmax〉 was 7.919, and the max and min were 23.452 and 0.561 nN, respectively. This large adhesion may be the result of the positively charged groups of the particle electrostatically binding with the negatively charged mucus network or glycocalyx on the cell surface or with the zwitterionic phospholipid groups contained within the cell (14), i.e., nonspecific force interactions. Alternatively, the positively charged particles may be undergoing a specific interaction and binding with the osteopontin proteins (52) or sphingosine-1-phospate groups (53), which contain negatively charged groups that have been reported to be overexpressed in B16F10 cells.
FIGURE 8.
An example of a force curve measured between a positively charged particle (a silica particle modified with Plus) and the B16F10 cell in the L-15 solution. The decompression force curve was measured after the particle resided at the cell surface for 10 min.
The effect of the different functionality groups on their adhesive strength to the B16F10 cell line can be easily compared if we plot the max, min, 〈Fadmax〉, and std values for each functionality group on the same graph; see Fig. 9. A comparison of all the data shows that silica, C1, C3, C6, and C18 all have similar low max, min, and 〈Fadmax〉 values. When the surface was modified to give a positive charge, however, much stronger max and 〈Fadmax〉 values were obtained. These data suggest that the Plus-modified particle had the highest affinity to the B16F10 cell. Additionally, all the groups except the Plus functional group had similar low std. The Plus functionality, however, had a relatively larger std. These data suggest that this adhesion was inherent to the malignant cells. This may be because a malignant cell can have mutations, whereas a normal cell is not expected to show such large deviations.
FIGURE 9.
The effect of the different functionality groups on their adhesive strength to the B16F10 cell. Here, the maximum (○), minimum (▵), and average values obtained for the maximum adhesive force (□) and its standard deviation (solid line) are compared for each functionality group (x axis).
The preceding results show the following in relation to the DDS. In the case of a normal cell, the affinity of a drug to a cell was thought to increase as the hydrophobicity of the carrier increased. In the example of a malignant cell, however, this did not appear to be the case. No improvement in the empathy was seen, as the hydrophobicity of the carrier was increased to give a surface with a contact angle of 109° (the contact angle was determined with a water droplet at the air–substrate interface). Thus, hydrophobic chains do not appear to be useful in improving the specificity of the carriers. The DDS carriers with positive charges therefore appear to have the highest affinity to malignant melanoma cells under these conditions. However, normal (nonmalignant cells) are also strongly negatively charged. Thus, the positively charged carriers should be protected in some way, e.g., with a macromolecule, so that the particle may reach the desired target without binding to other cells in the body beforehand (54).
CONCLUSIONS
In this experiment, we investigated the effect of different chemical functionality groups of a particle on its adhesion to a living malignant melanoma B16F10 cell by the AFM colloid probe method. We showed that we could create a colloid probe cantilever with the required functionality by using silane coupling agents.
We tested the effect of the charge and hydrophobicity on a DDS carrier on its degree of specificity to the melanoma cell. We were surprised to find that negatively charged surfaces and hydrophobic modified surfaces all had similar low adhesive force values if the particle was kept in contact with the cell for 10 min. Additionally, we saw the unexpected result that there was no observable dependence on the degree of hydrophobicity of the probe surface to a B16F10 cell if the chemical structure was not varied. Only the particle that was modified to give a positive charge was seen to give strong adhesive forces with the B16F10 cell. The high standard deviation in the adhesion force data that was only observed for the Plus-modified particle also suggested that this adhesion may be inherent to malignant cells.
The above results indicated that DDS carriers with positive charges appeared to have the highest affinity to malignant melanoma cells and that the use of hydrophobic materials, unexpectedly, did not improve their affinity.
Acknowledgments
The authors thank Dr. Shinpei Yamamoto (Kyoto University) for advice on the method of the modification of silica particles by silane coupling agents. We also thank Prof. Fukumori (Kobe Gakuin University) for kindly supplying the B16F10 cells necessary for the B16F10 cell line and Dr. Yoichi Kanda (Kyoto University) for useful discussions about the force measurements of cells.
Cathy McNamee thanks the Japanese Government for the financial support provided through the Japan Society for the Promotion of Science Postdoctorial Fellowship for Foreign Researchers.
References
- 1.Ferrari, M. 2005. Cancer nanotechnology: opportunities and challenges. Nat. Rev. Cancer. 5:161–171. [DOI] [PubMed] [Google Scholar]
- 2.Muller-Goymann, C. C. 2004. Physiochemical characterization of colloidal drug delivery systems such as reverse micelles, vesicles, liquid crystals and nanoparticles for topical administration. Eur. J. Pharm. Biopharm. 58:343–356. [DOI] [PubMed] [Google Scholar]
- 3.Alberts, A., A. Johnson, J. Lewis, M. Raff, K. Roberts, and P. Walter. 2002. Molecular Biology of the Cell. Garland Science, New York. 376.
- 4.Alberts, A., A. Johnson, J. Lewis, M. Raff, K. Roberts, and P. Walter. 2002. Molecular Biology of the Cell. Garland Science, New York. 1314.
- 5.Campisi, J. 2000. Cancer, aging and cellular sequence. In Vivo. 14:183–188. [PubMed] [Google Scholar]
- 6.Rowland, B. D., and D. S. Peeper. 2006. KLF4, p21 and context-dependent opposing forces in cancer. Nat. Rev. Cancer. 6:11–23. [DOI] [PubMed] [Google Scholar]
- 7.Neidle, S., and D. E. Thurston. 2005. Chemical approaches to the discovery and development of cancer therapies. Nat. Rev. Cancer. 5:285–296. [DOI] [PubMed] [Google Scholar]
- 8.Balczon, R., A. L. Gard, S. R. Kayes, W. E. Zimmer, and B. S. Pace. 1998. CH1, “Organization of the cell”. In Medical Cell Biology. S. R. Goodman, editor. Lippincott-Raven Publishers, New York. 1–25.
- 9.Septinus, M., T. Berthold, A. Naujok, and H. W. Zimmermann. 1985. Hydrophobic acridine-dyes for fluorescence staining of mitochondria in living cells. Histochemistry. 82:51–66. [DOI] [PubMed] [Google Scholar]
- 10.Chen, L. B. 1989. Fluorescent labeling of mitochondria. Methods Cell Biol. 29:103–123. [DOI] [PubMed] [Google Scholar]
- 11.Hüglin, D., W. Seiffert, and H. W. Zimmermann. 1995. Time resolved microfluorometric study of the binding sites of cationic pyrine probes in mitochondria of living HeLa cells. J. Photochem. Photobiol. B. 31:145–158. [DOI] [PubMed] [Google Scholar]
- 12.Irion, G., L. Ochsenfeld, A. Naujok, and H. W. Zimmermann. 1993. The concentration jump method—kinetics of vital staining of mitochondria in HeLa cells with lipophilic cationic fluorescent dyes. Histochemistry. 99:75–83. [DOI] [PubMed] [Google Scholar]
- 13.Röttele, J., and H. W. Zimmermann. 1993. Transport and accumulation of lipophilic dye cations at the mitochondria of HeLa-cells in situ. Cell. Mol. Biol. 39:739–756. [PubMed] [Google Scholar]
- 14.Leung, S. H. S., and J. R. Robinson. 1991. Bioadhesive drug delivery. ACS Symp. Ser. 467:350–366. [Google Scholar]
- 15.Kustanovich, I., D. E. Shalev, M. Mikhlin, L. Gaidukov, and A. Mor. 2002. Structural requirements for potent versus selective cytotoxicity for antimicrobial dermaseptin S4 derivatives. J. Biol. Chem. 277:16941–16951. [DOI] [PubMed] [Google Scholar]
- 16.Philip, S., A. Bulbule, and G. C. Kundu. 2001. Osteopontin stimulates tumor growth and activation of promatrix metalloproteinase-2 through nuclear factor-kappa B-mediated induction of membrane type 1 matrix metalloproteinase in murine melanoma cells. J. Biol. Chem. 276:44926–44935. [DOI] [PubMed] [Google Scholar]
- 17.Yamaguchi, H., J. Kitayama, N. Takuwa, K. Arikawa, I. Inoki, K. Takehara, H. Nagawa, and Y. Takuwa. 2003. Sphingosine-1-phosphate receptor subtype-specific positive and negative regulation and Rac and haematogenous metastasis of melanoma cells. Biochem. J. 374:715–722. [DOI] [PMC free article] [PubMed] [Google Scholar]
- 18.Hosooka, T., T. Noguchi, H. Nagai, T. Horikawa, T. Matozaki, M. Ichihashi, and M. Kasuga. 2001. Inhibition of the mobility and growth of B16F10 mouse melanoma cells by dominant negative mutants of Dok-1. Mol. Cell. Biol. 21:5437–5446. [DOI] [PMC free article] [PubMed] [Google Scholar]
- 19.Eliaz, R. E., and F. C. Szoka. 2001. Liposome-encapulated doxorubicin targeted to CD44: a strategy to kill CD44-overexpressing tumor cells. Cancer Res. 61:2592–2601. [PubMed] [Google Scholar]
- 20.Hale, L. P. 2002. Zinc alpha-2-glycoprotein regulates melanin production by normal and malignant melanocytes. J. Invest. Dermatol. 119:464–470. [DOI] [PubMed] [Google Scholar]
- 21.Fritz, M., M. Radmacher, and H. E. Gaub. 1994. Granular motion and membrane spreading during activation of human platelets imaged by atomic force microscopy. Biophys. J. 66:1328–1334. [DOI] [PMC free article] [PubMed] [Google Scholar]
- 22.Radmacher, M., M. Fritz, H. G. Hansma, and P. K. Hansma. 1994. Direct observation of enzyme-activity with the atomic-force microscope. Science. 265:1577–1579. [DOI] [PubMed] [Google Scholar]
- 23.Vadillo-Rodríguez, V., H. J. Busscher, W. Norde, J. de Vries, and H. C. van der Mei. 2003. On relations between microscopic and macroscopic physicochemical properties of bacterial cell surfaces: an AFM study in Streptococcus mitis strains. Langmuir. 19:2372–2377. [Google Scholar]
-
24.Dufr
 ne, Y. F. 2003. Recent progress in the application of atomic force microscopy imaging and force spectroscopy to microbiology. Curr. Opin. Microbiol. 6:317–323. [DOI] [PubMed] [Google Scholar]
 - 25.Ducker, W. A., T. J. Senden, and R. M. Pashley. 1991. Direct measurement of colloidal forces using an atomic force microscope. Nature. 353:239–241. [Google Scholar]
- 26.Niemeyer, C. M. 2001. Nanoparticles, proteins, and nucleic acids: biotechnology meets materials science. Angew. Chem. Int. Ed. Engl. 40:4128–4158. [DOI] [PubMed] [Google Scholar]
- 27.Alberts, A., A. Johnson, J. Lewis, M. Raff, K. Roberts, P. Walter 2002. Molecular Biology of the Cell. Garland Science, New York. 1315.
- 28.Ohno, K., T. Morinaga, K. Koh, Y. Tsujii, and T. Fukuda. 2005. Synthesis of monodisperse silica particles coated with well-defined, high-density polymer brushes by surface-initiated atom transfer radical polymerization. Macromolecules. 38:2137–2142. [Google Scholar]
- 29.Ishida, N., T. Inoue, M. Miyahara, and K. Higashitani. 2000. Nano bubbles on a hydrophobic surface in water observed by tapping-mode atomic force microscopy. Langmuir. 16:6377–6380. [Google Scholar]
- 30.Tyrrell, J. W. G., and P. Attard. 2002. Atomic force microscope images of nanobubbles on a hydrophobic surface and corresponding force-separation data. Langmuir. 18:160–167. [Google Scholar]
- 31.Christenson, H. K., and P. M. Claesson. 2001. Direct measurement of the force between hydrophobic surfaces in water. Adv. Colloid. Interface. Sci. 91:391–436. [Google Scholar]
- 32.McNamee, C. E., N. Pyo, S. Tanaka, I. U. Vakarelski, Y. Kanda, and K. Higashitani. 2006. Parameters affecting the adhesion strength between a living cell and a colloid probe when measured by the Atomic Force Microscope. Colloids Surf. B. Biointerfaces. 48:176–182. [DOI] [PubMed] [Google Scholar]
- 33.Cegnar, M., J. Kristl, and J. Kos. 2005. Nanoscale polymer carriers to deliver chemotherapeutic agents to tumours. Expert Opin. Biol. Ther. 5:1557–1569. [DOI] [PubMed] [Google Scholar]
- 34.Velegol, S. B., and B. E. Logan. 2002. Contributions of bacterial surface polymers, electrostatics, and cell elasticity to the shape of AFM force curves. Langmuir. 18:5256–5262. [Google Scholar]
- 35.Razatos, A., Y. L. Ong, M. M. Sharma, and G. Georgiou. 1998. Molecular determinants of bacterial adhesion monitored by atomic force microscopy. Proc. Natl. Acad. Sci. USA. 95:11059–11064. [DOI] [PMC free article] [PubMed] [Google Scholar]
- 36.Camesano, T. A., and B. E. Logan. 2000. Probing bacterial electrostatic interactions using atomic force microscopy. Environ. Sci. Technol. 34:3354–3362. [Google Scholar]
- 37.Ong, Y. L., A. Razatos, G. Geogiou, and M. M. Sharma. 1999. Adhesion forces between E-coli bacteria and biomaterial surfaces. Langmuir. 15:2719–2725. [Google Scholar]
- 38.McNamee, C. E., N. Pyo, S. Tanaka, Y. Kanda, and K. Higashitani. 2006. Imaging of a soft, weakly adsorbing, living cell with a colloid probe tapping atomic force microscope technique. Colloids Surf. B. Biointerfaces. 47:85–89. [DOI] [PubMed] [Google Scholar]
- 39.Kwok, D. Y., and A. W. Neumann. 1999. Contact angle techniques and measurements. In Surface Characterization Methods Principles, Techniques, and Applications. A. J. Milling, editor. Marcel Dekker, New York. 37–86.
- 40.Wenzler, L. A., G. L. Moyers, L. G. Olson, J. M. Harris, and T. P. Beebe. 1997. Single molecule bond-rupture force analysis of interactions between AFM tips and substrates modified with organosilanes. Anal. Chem. 69:2855–2861. [Google Scholar]
- 41.Silberzan, P., L. Légar, D. Ausserré, and J. J. Benattar. 1991. Silanation of silica surfaces: a new method of constructing pure or mixed monolayers. Langmuir. 7:1647–1651. [Google Scholar]
- 42.Hartley, P. G., I. Larson, and P. J. Scales. 1997. Electrokinetics and direct force measurements between silica and mica surfaces in dilute electrolyte solutions. Langmuir. 13:2207–2214. [Google Scholar]
- 43.Ishida, N., M. Sakamoto, M. Miyahara, and K. Higashitani. 2000. Attraction between hydrophobic surfaces with and without gas phase. Langmuir. 16:5681–5687. [Google Scholar]
- 44.Nguyen, A. V., J. Nalaskowski, J. D. Miller, and H. J. Butt. 2003. Attraction between hydrophobic surfaces studies by atomic force microscopy. Int. J. Miner. Process. 72:215–225. [Google Scholar]
- 45.Sharma, A., S. N. Tan, and J. Y. Waltz. 1997. Measurement of colloidal stability in solutions of simple, nonadsorbing polyelectrolytes. J. Colloid Interface Sci. 190:392–407. [DOI] [PubMed] [Google Scholar]
- 46.Radmacher, M. 2002. Measuring the elastic properties of living cells by the atomic force microscope. In Methods in Cell Biology. B. P. Jena and J. K. H. Hörber, editors. Academic Press, Amsterdam. 67. [DOI] [PubMed]
- 47.Leckband, D., and J. Israelachvili. 2001. Intermolecular forces in biology. Q. Rev. Biophys. 32:105–267. [DOI] [PubMed] [Google Scholar]
- 48.Wennerstrom, H. 2003. Influence of dissolved gas on the interaction between hydrophobic surfaces in water. J. Phys. Chem. B. 107:13772–13773. [Google Scholar]
- 49.Reference deleted in proof.
- 50.Reference deleted in proof.
- 51.Vogt, P. K. 1993. Cancer genes. West. J. Med. 158:273–278. [PMC free article] [PubMed] [Google Scholar]
- 52.Philip, S., A. Bulbule, and G. C. Kundu. 2001. Osteopontin stimulates tumor growth and activation of promatrix metalloproteinase-2 through nuclear factor-kappa B-mediated induction of membrane type 1 matrix metalloproteinase in murine melanoma cells. J. Biol. Chem. 276:44926–44935. [DOI] [PubMed] [Google Scholar]
- 53.Yamaguchi, H., J. Kitayama, N. Takuwa, K. Arikawa, I. Inoki, K. Takehara, H. Nagawa, and Y. Takuwa. 2003. Sphingosine-1-phosphate receptor subtype-specific positive and negative regulation and Rac and haematogenous metastasis of melanoma cells. Biochem. J. 374:715–722. [DOI] [PMC free article] [PubMed] [Google Scholar]
- 54.Torchilin, V. P. 2001. Structure and design of polymeric surfactant-based drug delivery systems. J. Controlled Release. 73:137–172. [DOI] [PubMed] [Google Scholar]


