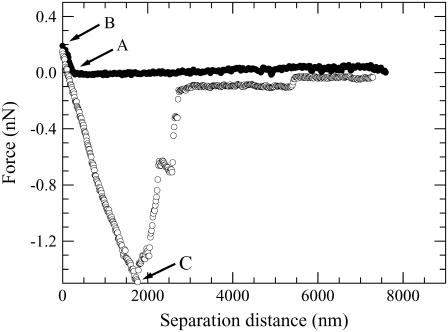
FIGURE 6.
An example of a force curve measured between a bare silica particle (negative charge) and a B16F10 cell in the L-15 solution. The decompression force curve was measured after the particle resided at the cell surface for 10 min. Points A, B, and C depict the surface of the cell, the position relative to the cell surface where the particle resided for 10 min, and the maximum adhesion force, respectively.

