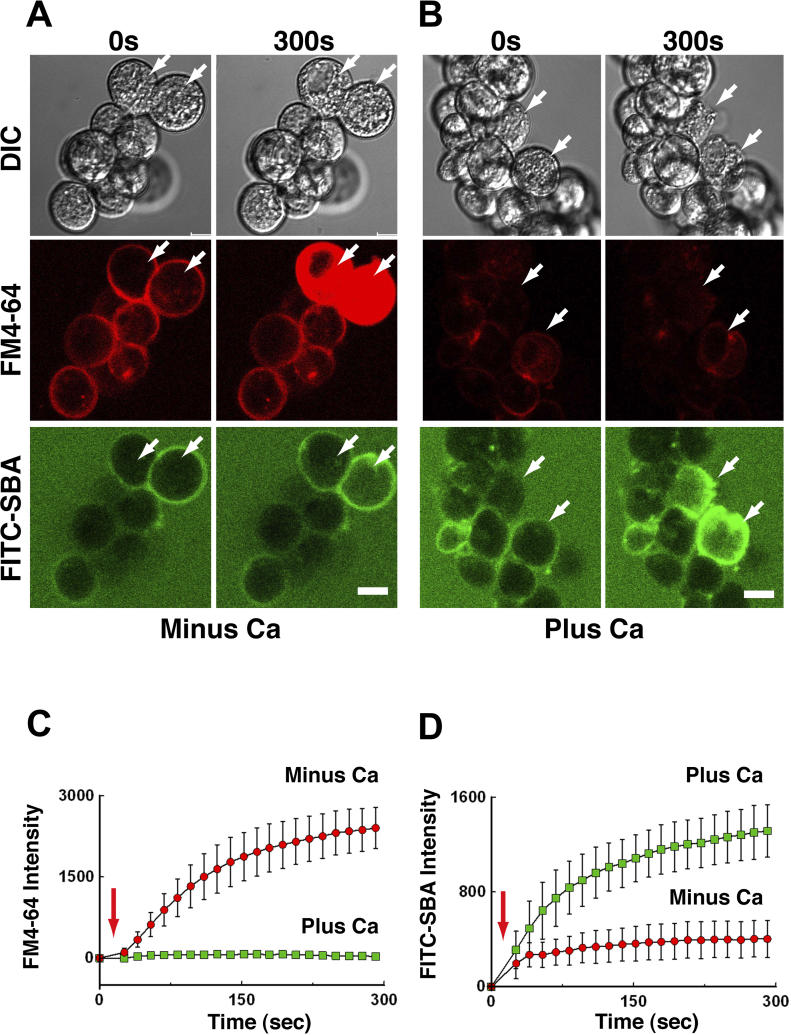
Figure 3. Cell Resealing and Mucus Secretion Are Ca2+-Dependent, Concurrent Events in Surface Mucous Cells.
(A) A cluster of gastric mucous cells was imaged by confocally before (0 s) and after (300 s) wounding of two cells (arrows) with a laser in the absence of Ca2+ (Minus Ca). Shown are differential interference contrast (DIC), and fluorescence images of FM4–64 dye (red channel), which stains the cytoplasmic membranes of cells that fail to reseal, and of FITC-SBA (green channel), which stains extracellular mucus. Note that strong cytoplasmic staining with FM4–64 is seen 300 s after wounding, whereas no detectable increase in surface staining with FITC-SBA is observed at this time point.
(B) A cluster of gastric mucous cells wounded and imaged as in (A) but in the presence of 1.5 mM Ca2+ (Plus Ca). Note that very little cytoplasmic staining with FM4–64 is seen 300 s after wounding, whereas strong surface staining with FITC-SBA is observed at this time point.
(C) Entry of FM 4–64 dye into cell cytoplasm was monitored over time after laser wounding (arrow). In the presence of extracellular Ca2+ (Plus Ca), a small amount of dye entry is detectable only during the first 20–30 s post-wounding, indicating that resealing was completed within this time frame. In the absence of extracellular Ca2+ (Minus Ca), entry of dye continues until, at approximately 100 s, internal membranes reach a saturation point. Resealing failed in these cells (n = 3). Bars indicate the standard error of the mean.
(D) Surface staining intensity of the cells with FITC-SBA monitored over time after laser wounding (red arrow). In the presence of extracellular Ca2+ (Plus Ca2+), an increase in surface staining is detectable at 50 s post-wounding and continues throughout the time course of the experiment, indicating that, concurrently with resealing, mucus was being exocytosed. In the absence of Ca2+ (Minus Ca2+), by contrast, only a slight increase in staining was observed (n = 3). Bars indicate the standard error of the mean.

