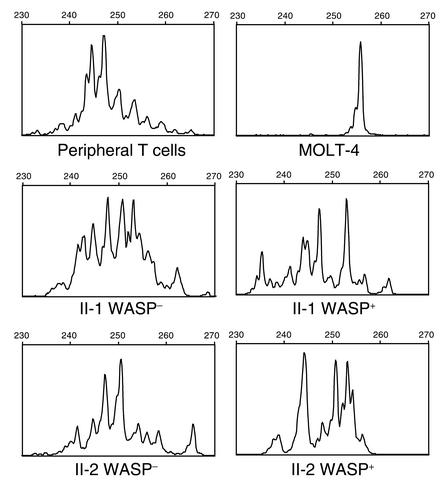
Figure 5.
Analysis of TCR-β gene rearrangements. Gaussian-like distribution of TCR-β gene rearrangements observed in normal control CD3+ T lymphocytes and monoclonal rearrangement pattern detected in MOLT-4 leukemic cells are shown as controls for the results obtained from the study of TCR-β gene rearrangements in WASP– and WASP+ cells sorted from patients II-1 and II-2.

