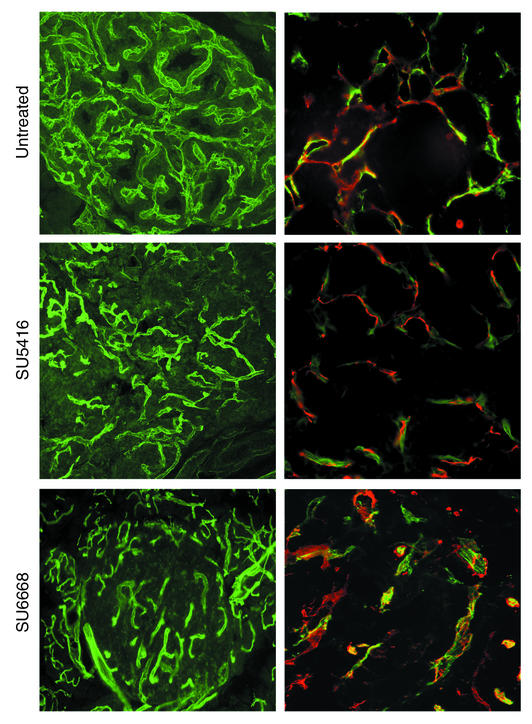
Figure 2.
Comparison of vascular morphology (left panels) and association of endothelial cells and perivascular cells (right panels) in treated versus control tumors. Tumor-bearing pancreata were taken from end-stage 13.5-week-old control Rip1Tag2 mice and from 16-week-old Rip1Tag2 mice treated with SU5416 or SU6668 (Regression Trial). To visualize the functional blood vessels in tumors, mice were first anesthetized and injected intravenously with 0.05 mg FITC-labeled tomato lectin (Lycopersicon esculentum) and then heart perfused with 4% PFA. Pancreata were frozen in OCT medium and sectioned at 50 μm. To visualize endothelial cells (green in right panels) and pericytes (red in right panels) by immunohistochemical analysis, mice were anesthetized, heart perfused with PFA, and pancreata collected, frozen in OCT medium, and 15-μm sections prepared. Endothelial cells were detected with FITC-labeled lectin; pericytes were identified with CY3-labeled anti-desmin (1:3,000), a marker of mature pericytes.

