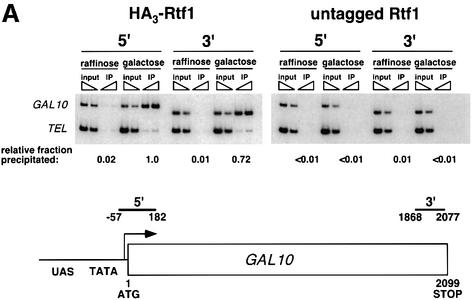
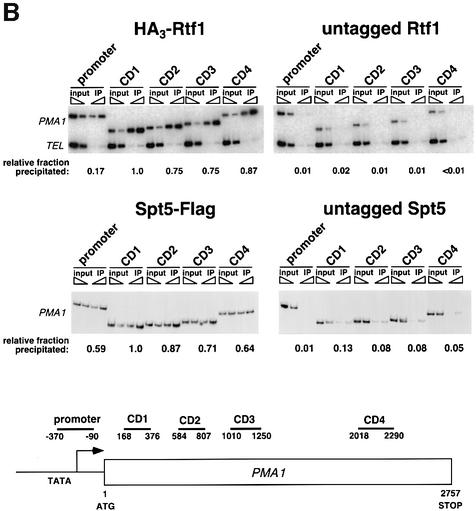
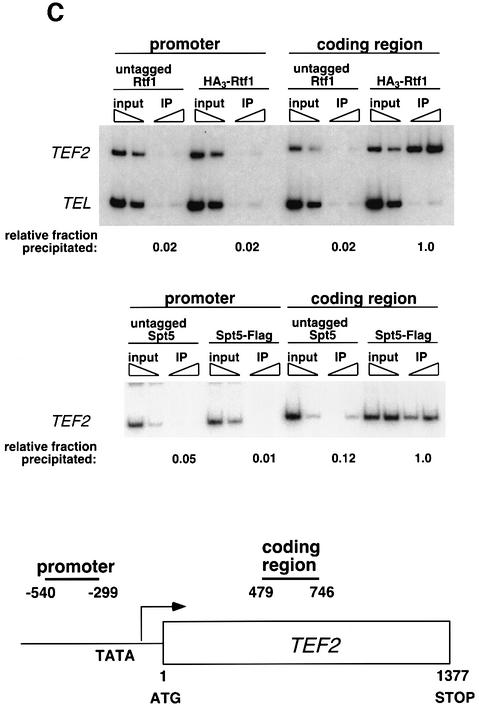
Fig. 3. Rtf1 and Spt5 associate with the coding regions of genes. (A) ChIP analysis of Rtf1 on the GAL10 gene was performed on transformants of yeast strain KY399 that expressed HA3-Rtf1 or untagged Rtf1. Strains were grown in media containing raffinose, and GAL gene transcription was induced by addition of 2% galactose for 20 min. Cross-linked chromatin was immunoprecipitated with anti-HA1 antibody, and PCR was conducted on two dilutions of input DNA and two different amounts of precipitated DNA, as indicated. Locations of the 5′ and 3′ primer pairs, relative to the ATG, are given at the bottom. (B) ChIP analysis of Rtf1 and Spt5 on the PMA1 gene. For Rtf1, chromatin isolated from glucose-grown cultures was subjected to ChIP with antibody against HA1 as described in (A). For Spt5, chromatin was isolated from glucose-grown cultures of strains GHY1300 (Spt5-Flag) and FY118 (Spt5). Promoter and coding region primer sequences were described previously (Cho et al., 2001), and the locations of the predicted PCR products are shown at the bottom. (C) ChIP analysis of Rtf1 and Spt5 on the TEF2 gene. Chromatin isolated from glucose-grown cultures was subjected to ChIP as in (B). Locations of promoter (TEF2 set 2) and coding region (TEF2 set 5) primer sequences, relative to the ATG, are given below. For each ChIP experiment, PCR products were quantitated by phosphoimager analysis, divided by the corresponding input DNA signal, and normalized arbitrarily to the sample with the highest percentage input value. Subtelomeric primer sequences from chromosome VI (Vogelauer et al., 2000) were used as a control.

An official website of the United States government
Here's how you know
Official websites use .gov
A
.gov website belongs to an official
government organization in the United States.
Secure .gov websites use HTTPS
A lock (
) or https:// means you've safely
connected to the .gov website. Share sensitive
information only on official, secure websites.


