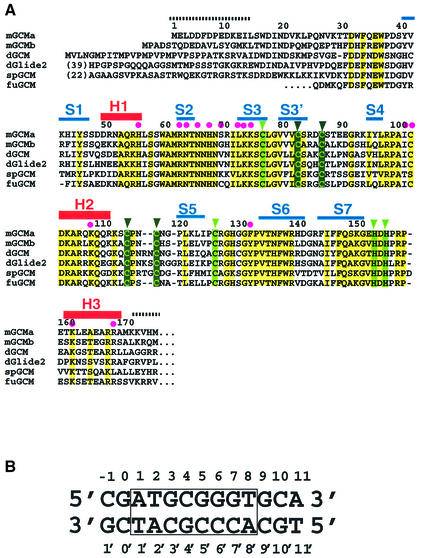
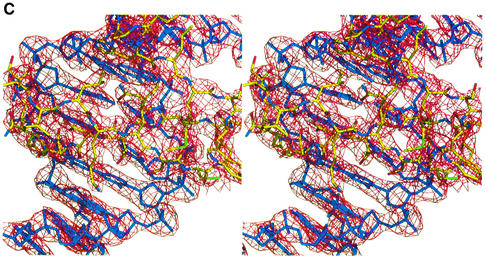
Fig. 1. (A) Alignment of the GCM domains from mouse (mGCMa, mGCMb), Drosophila melanogaster (dGCM, dGlide2), sea urchin (spGCM) (Ransick et al., 2002) and the pufferfish fugu (fuGCM). Conserved residues and conservatively substituted residues are drawn on a yellow background. Secondary structure elements are shown above the mGCMa sequence. Regions indicated by broken lines are disordered and have not been included in the final model. Magenta dots indicate DNA-contacting residues; light green and dark green triangles indicate residues coordinating the first and second Zn ions, respectively. (B) Sequence of the 13mer DNA duplex present in crystal forms A and A′. The octameric target site is numbered from 1 to 8 (1′ to 8′ for the opposite strand) and boxed. Flanking base pairs upstream and downstream of the target site are numbered –1 to 0 and 9 to 11, respectively. (C) Stereo diagram of the final 2Fo – Fc electron density map contoured at 1.5σ. Strands S2 and S3 and the contacted DNA target site are shown. The figure was produced using the program BOBSCRIPT (Esnouf, 1999).

An official website of the United States government
Here's how you know
Official websites use .gov
A
.gov website belongs to an official
government organization in the United States.
Secure .gov websites use HTTPS
A lock (
) or https:// means you've safely
connected to the .gov website. Share sensitive
information only on official, secure websites.

