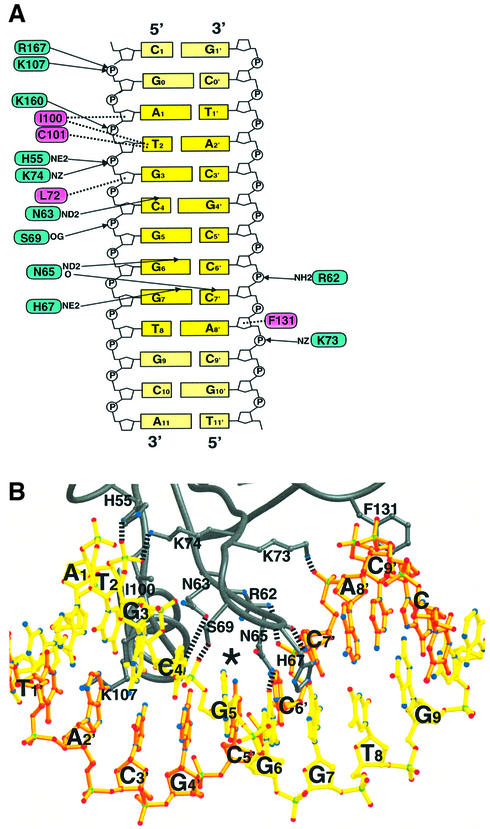
Fig. 3. DNA recognition by the GCM domain. (A) Protein–DNA interactions between the GCM domain and its DNA target site. Arrows and dotted lines indicate polar and hydrophobic interactions, respectively. Residues involved in polar and hydrophobic interactions are drawn on blue and magenta backgrounds, respectively. (B) Ribbon representation of the interactions between the GCM domain and its DNA target site Upper and lower strands as shown in Figure 1B are depicted in yellow and orange, respectively. Broken lines indicate polar interactions.

An official website of the United States government
Here's how you know
Official websites use .gov
A
.gov website belongs to an official
government organization in the United States.
Secure .gov websites use HTTPS
A lock (
) or https:// means you've safely
connected to the .gov website. Share sensitive
information only on official, secure websites.
