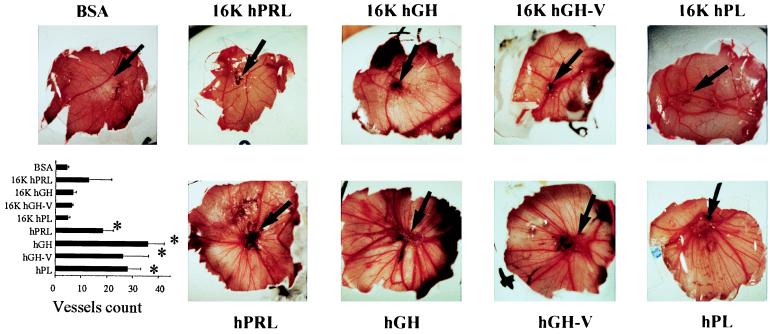
Figure 3.
Late-stage CAM assay showing stimulation of blood vessel formation in the CAM: Representative examples of CAM are taken from a typical experiment. The black arrow shows the border of the disk. The lower left panel shows the quantification of the assay performed by counting the number of blood vessels emerging from the disk. Vessels were scored in function of size from 1 (small) to 3 (large). Values are means ± SEM. ∗, P < 0.05 vs. BSA.

