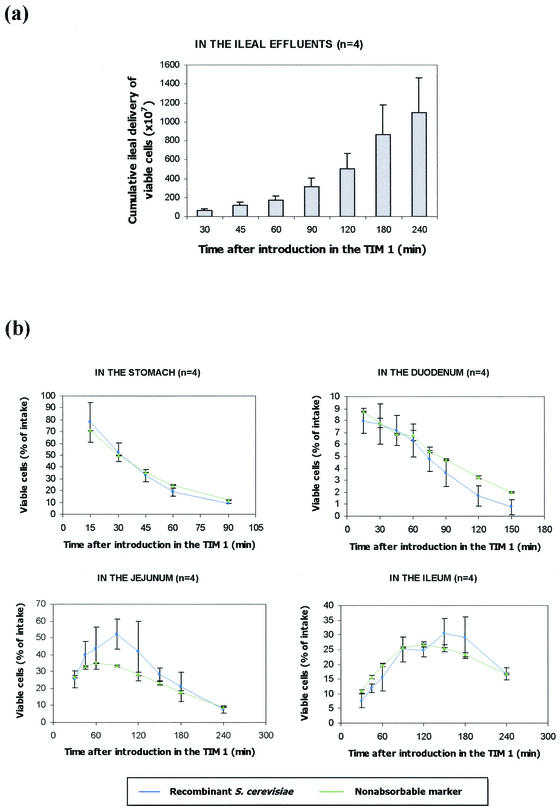
FIG. 3.
Survival rate of the recombinant model of S. cerevisiae in TIM 1. Panel a represents the mean cumulative ileal delivery of viable cells ± standard deviation (n = 4). The curves obtained in each digestive compartment for the recombinant yeasts (blue circles) and for a nonabsorbable marker, blue dextran (green triangles), are shown in panel b. Values are expressed as mean percentages ± standard deviation (n = 4) of the initial intake.

