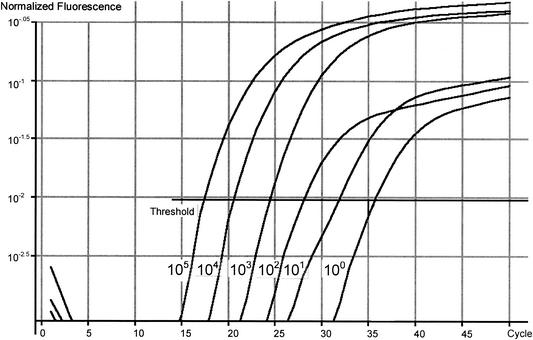
FIG. 1.
Real time PCR log graph of an 18Si Taqman PCR assay conducted with oocyst DNA extracts containing from 100,000 oocysts to a single oocyst by using the RotorGene 2000. Normalized fluorescence was used to determine the average background for each sample by using the first five cycles and fluorescence as an indicator for the background level for each sample. All data points were then divided by this value to normalize the data and were converted to a log scale. The number of PCR cycles is indicated on the x axis. Ct values determined for individual standards were as follows: 100,000 oocysts, 18.2; 10,000 oocysts, 20.72; 1,000 oocysts, 24.67; 100 oocysts, 29.0; 10 oocysts, 33.5; and 1 oocyst, 41.1.

