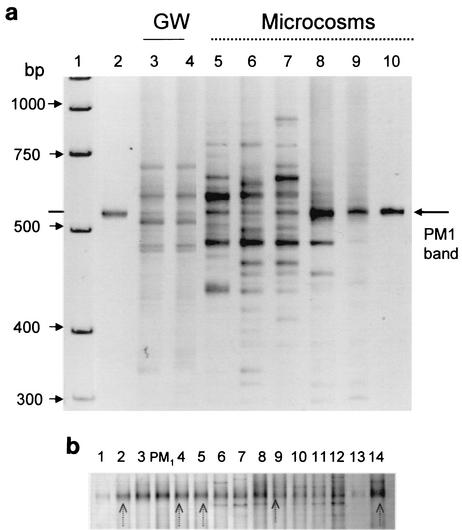
FIG. 3.
(a) Detection of PM1 band in ITS fingerprints of groundwater (GW) or sand samples from the LTF and after incubation in laboratory microcosms. Lane 1, a DNA marker; lanes 2 and 10, PM1 pure culture DNA; lanes 3 and 4, groundwater from well K3 in the LTF; lanes 5 to 7, K3 groundwater from lab microcosms containing sand; lanes 8 and 9, DNA extracted from sand from the same microcosms. (b) Detection of PM1 band in DNA amplified with16S rDNA PM1 DGGE primers extracted from groundwater samples from the LTF and after incubation in laboratory microcosms. Lanes 1 to 4 are groundwater from the microcosms shown in Fig. 5, lanes 5 to 13 are groundwater from the LTF, and lane 14 is a microcosm with a sediment sample collected from the UW8 location outside the LTF. PM1 pure culture DNA has been used as a control. Arrows show bands that were sequenced.

