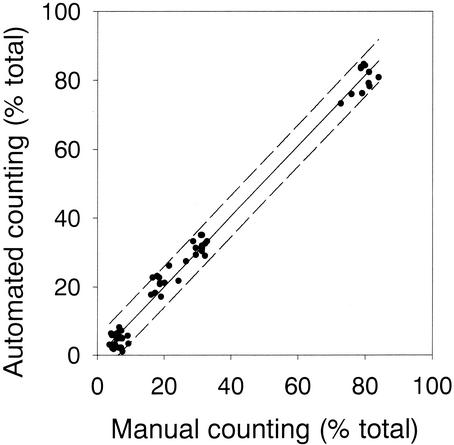
FIG. 4.
Correspondence beween manual counting and fully automated evaluation of samples hybridized with various probes. The lower signal-to-noise ratio for detection of probe-positive cells was 1.3 (130% of background gray value). Broken indicate the prediction interval of a linear regression (solid line) of manual versus automated counting.

