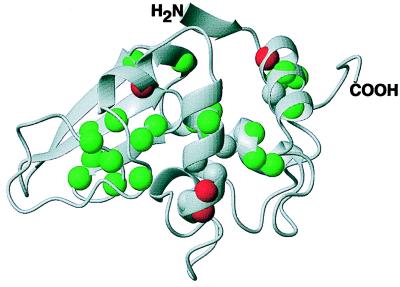
Figure 4.
A ribbon diagram of the three-dimensional structure of lysozyme. Spheres are drawn at the positions of the appropriate amide nitrogens and color-coded by the stability factor class (see text): Sf measured to be <1 (red spheres), Sf measured or estimated to be >1 (green spheres), and Sf that could not be reliably estimated from our data (gray spheres). This figure was prepared with molmol (45) using the Protein Data Bank file 1hew. The NH2 and COOH groups mark the amino and carboxyl termini, respectively, of the protein.

