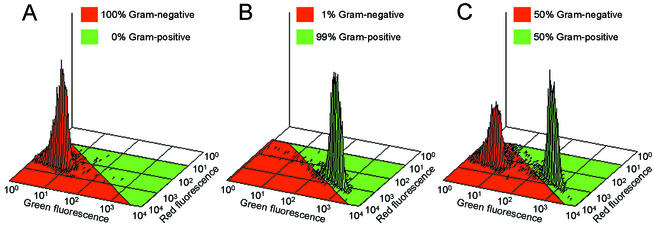
FIG. 3.
Isometric flow-cytometric plots. (A) E. coli; (B) M. luteus; (C) mixed culture (1:1) of E. coli and M. luteus. Percentages are calculated as the number of events in the red region (gram negative) or green region (gram positive) divided by the total number of events. The results were obtained by using the procedure described in “Gram-staining technique for bacterial cultures.”

