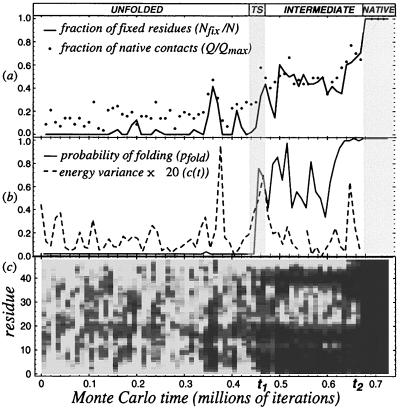
Figure 2.
Qualitative and quantative probes of a folding event. (a) shows the number of native contacts Q and the number of “fixed” (blue) residues Nfix along the folding trajectory. (b) shows the folding probability pfold (see Methods) and the energy variance < (δ E)2 > of the conformations between t ± 1.5 × 10⁴. (c) shows the positional variance < δ ri 2 > vs. time on the horizontal axis and position along the chain on the vertical axis, by using the same shading as in Fig. 1. Note that the static (i.e., dark) residues are clustered in patches for t1 < t < t2, representing the persistent core of the intermediate; for t > t2 all residues become fixed in their native positions, and the polymer is folded.

