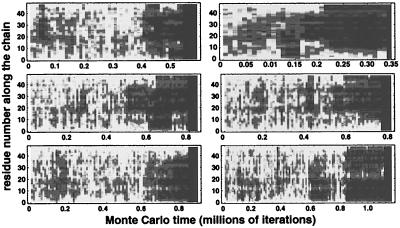
Figure 3.
Fluctuation smears for six different folding events. As in Fig. 2c, we plot the variance of the position of a residue (averaged over an interval of 104 steps) as a function of time for six different simulation runs at T = 0.65 with different initial configurations. Each event encounters one or more intermediate regimes of specific partial structure before folding.

