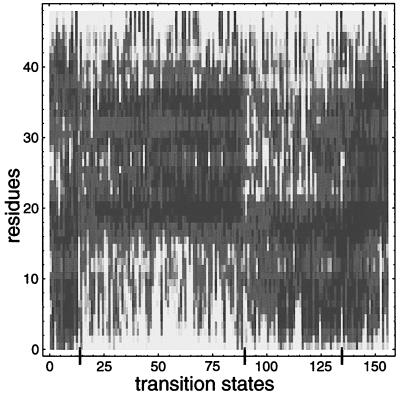
Figure 5.
Characterization of the transition-state ensemble. The variances of transition-state conformations from 156 independent folding runs at T = 0.65 are displayed by using the shading scheme of Fig. 1. Conformations have been sorted to exhibit the natural partitioning of these conformations into distinct transition state classes. Superimposed on the common structure within each class are various optional structures; these contribute to the entropy of the transition state. As the transition state is structurally similar to the intermediate (see Fig. 4), Fig. 5 also describes the nature of the intermediates found in this system.

