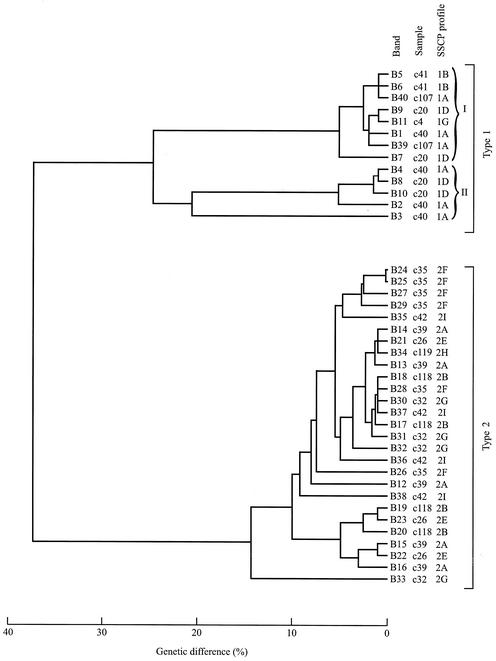
FIG. 3.
Phenograms depicting the genetic difference (in percent, upon pairwise comparison) among pITS-2 sequences representing 40 bands individually excised from an SSCP gel (Fig. 1). Thirteen and 27 band sequences represent C. parvum type 1 and type 2, respectively. SSCP profiles 1A, 1B, 1D, and 1G relate to samples c107 (United Kingdom), c41 (Spain), c20 (Kenya), and c4 (Caicos Islands), respectively, and profiles 2A, 2B, 2E, 2F, 2G, 2H, and 2I relate to samples c39 (Spain), c118 (Spain), c26 (Africa), c35 (Cyprus), c32 (Turkey), c119 (Pakistan), and c42 (Mexico), respectively. Type 1 sequences separate into two distinct clusters (I and II) (using a threshold of ∼22% difference).

