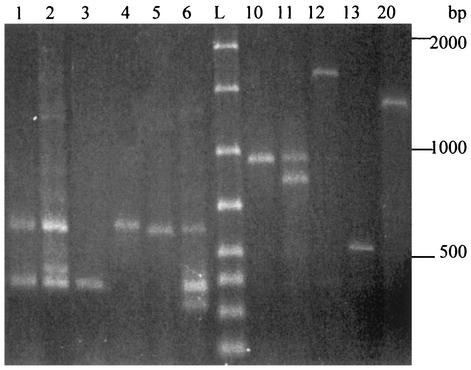
FIG. 4.
RAPD typing of atypical Pseudomonas isolates performed with primer S. Lanes 1 to 6, profiles R-1 to R-6, respectively, generated by atypical P. viridiflava isolates; lanes 10 to 13, R profiles corresponding to P. syringae pv. syringae strains; lane 20, R profile of P. syringae pv. phaseolicola; lane L, molecular size standards. The distribution of the isolates within different profiles is shown in Table 1.

