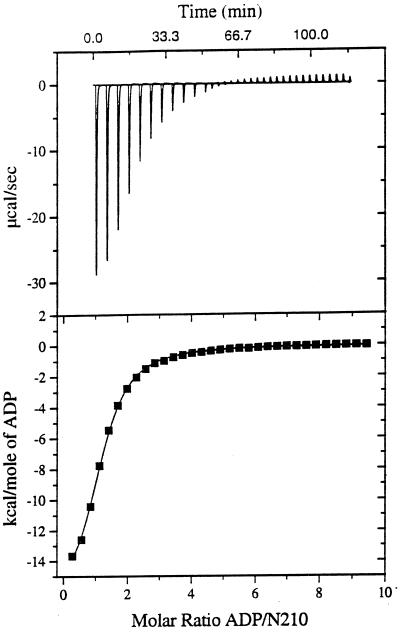
Figure 2.
Titration of N210 with ADP as detected by calorimetry. (Upper) Raw data obtained for 32 automatic injections (4 μl each) of an ADP solution (16.9 mM) into the sample cell containing N210 at 180 μM in 10 mM potassium phosphate, pH 6.9/100 mM sodium chloride/30 mM MgCl2. (Lower) Plot of processed data. The solid line corresponds to the best-fit curve obtained by least-squares deconvolution. The best values for fitting parameters are 1.03 for n (number of sites), 25,000 M−1 for K (binding constant), and −17,100 cal/mol for ΔH. The standard deviation of points from the calculated line is 0.069% of the total integral heat for saturating all sites in the N210 sample. ATP hydrolysis did not interfere with the calorimetric experiments, since the turnover number of both N210 and N272 is very low under the conditions used (cf. ref. 5; additional data not shown).

