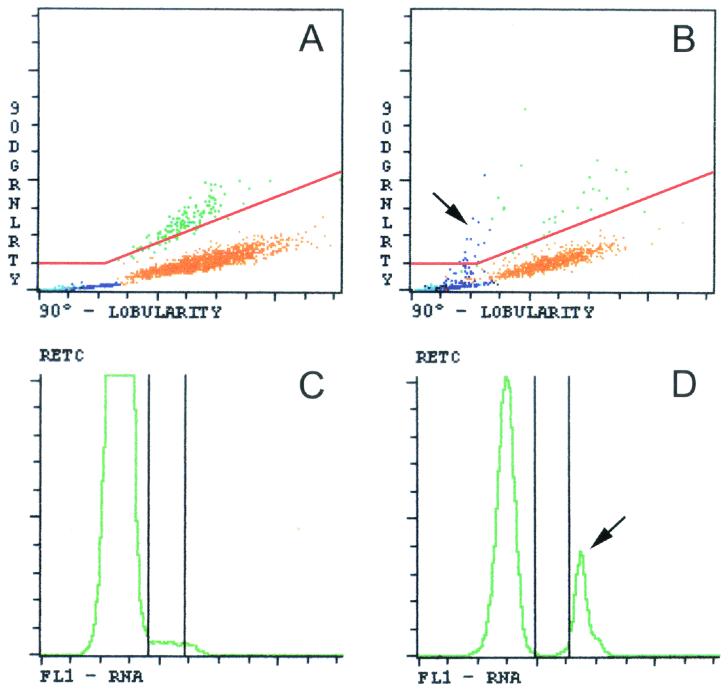
FIG. 1.
Differential white blood cell plots and reticulocyte histograms generated by the Cell-Dyn 4000 hematology analyzer from the peripheral blood of patients with and without malaria. (A) Differential lobularity-granularity plot of the white blood cells from a patient without malaria. Monocytes are shown in purple, lymphocytes are shown in blue, neutrophils are shown in orange, eosinophils are shown in green, and basophils are shown in black. The differential lobularity-granularity plot depicts the results of a lobularity analysis (90° lobularity) versus those of a depolarization analysis (90° depolarized granularity [90DGRNLRTY]). (B) Lobularity-granularity plot of a patient with P. falciparum malaria. Note the presence of hemozoin-containing depolarizing monocytes as purple dots above the separation line (see arrow). (C and D) Reticulocyte histograms (RETC) of a patient without malaria (C) and of a patient with P. falciparum malaria (D). Note the presence of a distinct fluorescent spike representing nuclear material of intraerythrocytic malaria parasites (arrow). FL1, fluorescence intensity.

