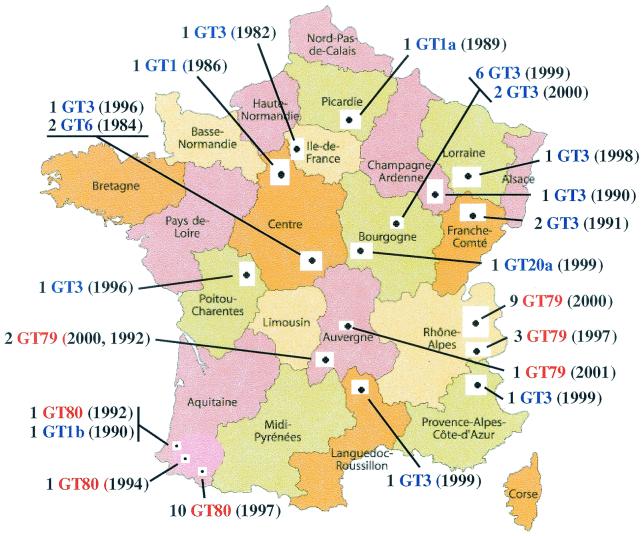
FIG. 1.
Locations of B. anthracis isolates. This map shows the regions where isolates of B. anthracis were obtained for this genetic study. The actual collection sites are indicated by the small solid black dots. The labels indicate the number of isolates from a location, the genotype (GT), and the year the isolate was collected [e.g., 1 GT3 (1985)]. The red GT numbers are from cluster B2, while the blue GT numbers are from cluster A1a in Fig. 2. Intercarto map adapted with permission.

