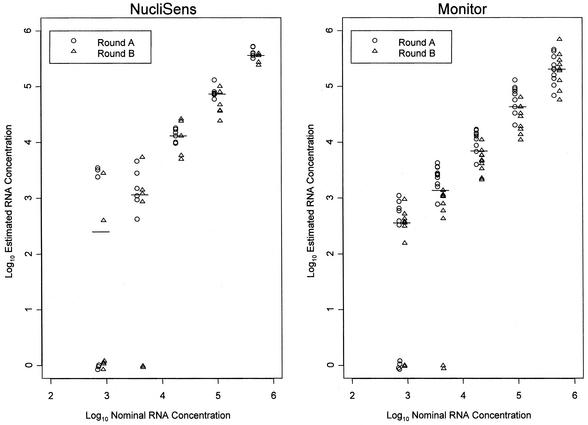
FIG. 1.
Log10 estimated HIV RNA concentrations plotted against log10 nominal HIV RNA concentrations for the NucliSens and Monitor assays. Panel 1 specimens were tested on two different occasions (round A and round B). The horizontal line represents the median estimated concentration at each nominal concentration.

