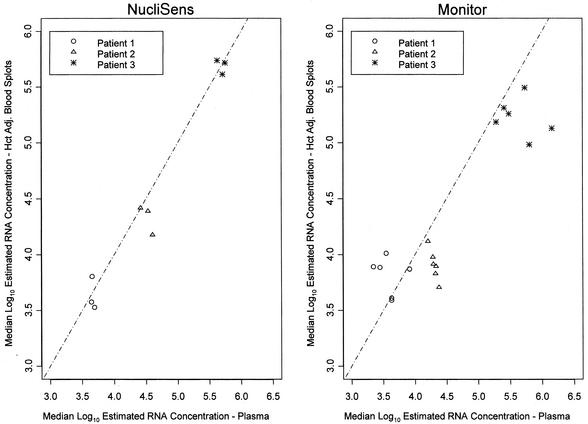
FIG. 2.
Results for panel 2 showing the median log10 hematocrit-adjusted (Hct Adj.) estimated HIV RNA concentrations in DBSs in each laboratory plotted against the median log10 estimated HIV RNA concentrations in plasma for all laboratories in which the same kit was used. The dotted line represents the line of equivalence.

