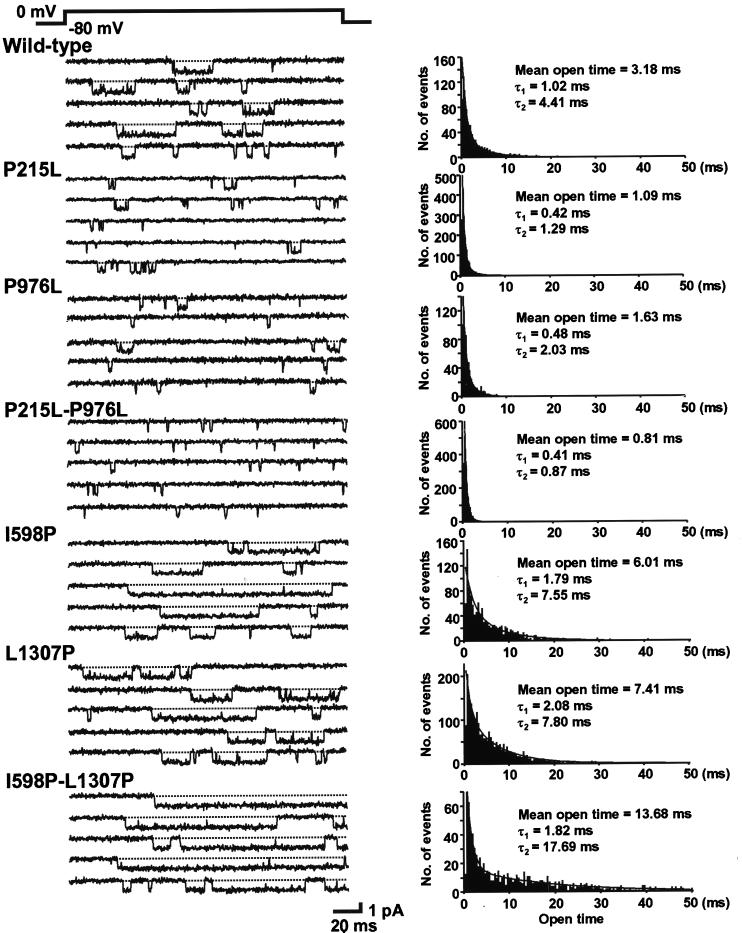
Figure 2.
Single-channel currents recorded from oocytes expressing the wild-type and mutant Ca2+ channels. Currents were elicited by 180-ms depolarization pulses to 0 mV from a holding potential of −80 mV. Representative current traces are shown in Left. Traces with no channel activity are not shown. Corresponding open time histograms are shown in Right. The smooth curves represent best fits with double exponentials. The values of two time constants, together with the mean open times, are shown in the insets.

