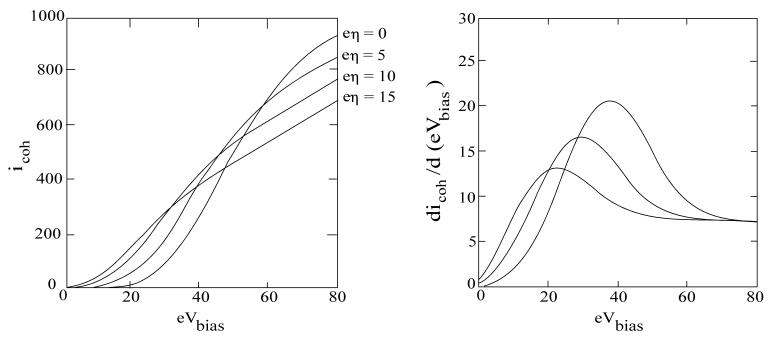
Figure 4.
(Left) Current–bias voltage relations for the configuration in Figs. 2 and 3. The correlations show the variation of the double integral in Eq. 3, with the level densities and the approximately constant tunnel factors disregarded. Energy quantities in units of kBT (=25 mV). Es = 20 (0.5 V); α = 0.5. The bias voltage range spanned thus is 2 V. The four curves correspond to the overvoltages indicated, with 0–15 corresponding to 0–0.375 V. The inflection points follow eη. (Right) Derivatives of the current–bias relation showing the structural feature as the redox level crosses ɛFneg.

