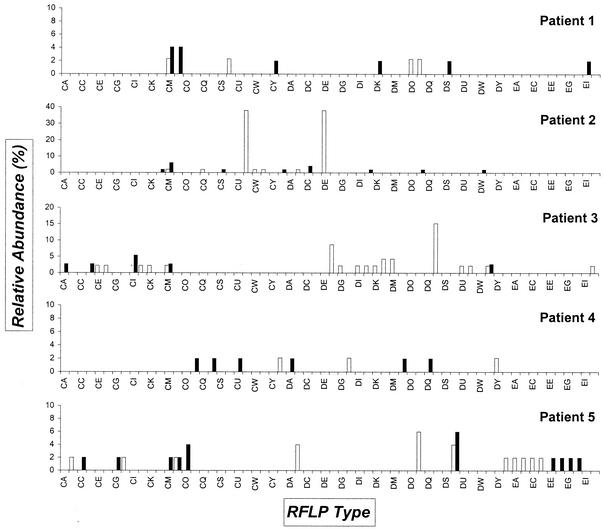
FIG. 5.
Overview of the 16S rDNA RFLP types that are present in the patients and absent from the controls. Open bars indicate the clones identified from the urine sediment obtained during the first visit (t = 0); solid bars indicate clones from the sediment collected at the second visit (t = 1). On the horizontal axis, the RFLP types are identified; on the vertical axis, the relative abundance of the types is shown. For a definition of relative abundance, see legend to Fig. 1. Table 4 shows the sequence-based identification of a selection of these clones.

