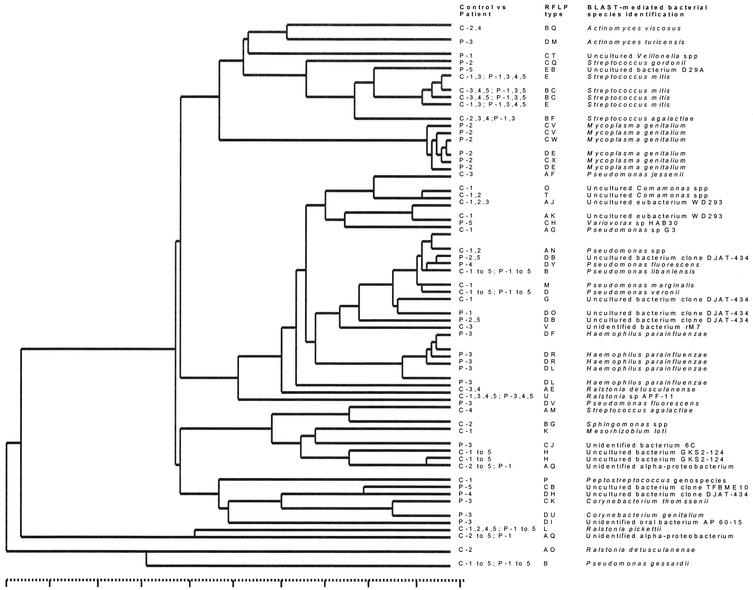
FIG. 6.
Phylogram based on comparative analysis of the ribosomal sequences obtained for the clones derived from urine sediments of patients and controls. The tree was constructed from a weighted residue weight table. Clones B and D are the types that are most prevalent among both patients and controls (present in P1 to P5 and C1 to C5). The entries derived from the patients' clones are identified by patient numbers (see also Table 4). The clones are identified to a putative species level on the basis of BLAST searching. Clusters harboring streptococci, the M. genitalium sequences, or the Haemophilus and Pseudomonas spp.-like sequences are obvious. The scale at the bottom runs from 0 to 100% homology.

