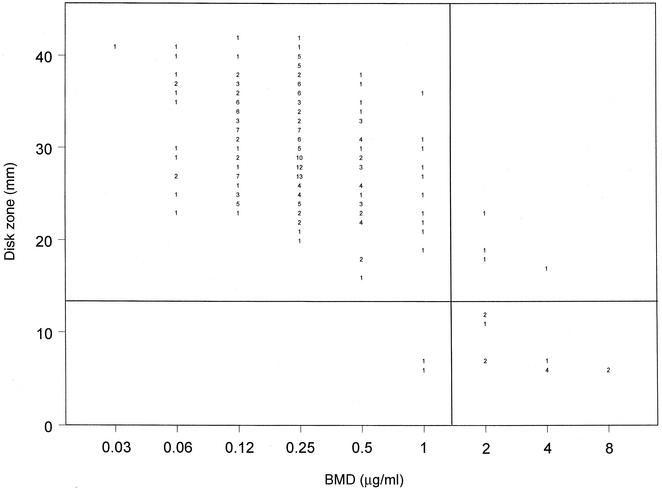
FIG. 2.
Zones of inhibition around 1-μg voriconazole disks plotted against the MICs determined at 48 h by the reference BMD method for 235 C. glabrata isolates. The method of least squares was used to calculate a regression line (y = 55.8 − 3.8x; R = 0.7). The horizontal line indicates the putative S zone diameter breakpoint (≥14 mm) for the voriconazole disk test. The vertical line indicates the putative S MIC breakpoint (≤1 μg/ml) for voriconazole. The numbers inside the graph indicate numbers of isolates.

