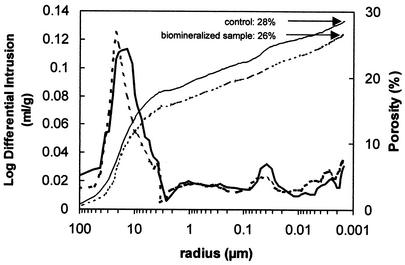
FIG. 9.
Representative MIP plots showing both the cumulative intrusion curves (i.e., porosity) and pore size distribution curves [i.e., log of differential intrusion, or log(dv/dr), versus r, where v is the intruded volume and r is the pore radius] for fresh (solid line) and biomineralized (dotted line) stone samples.

