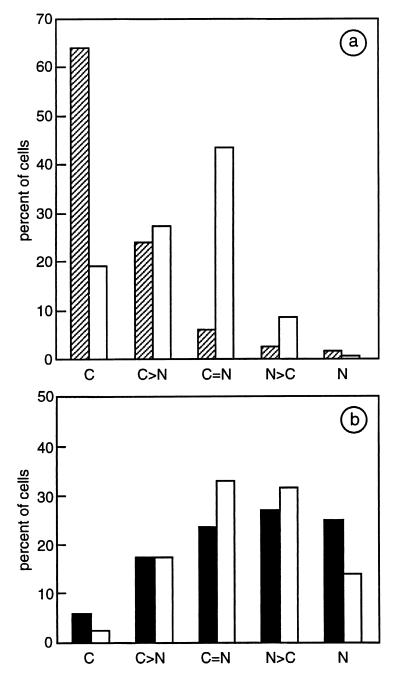
Figure 2.
Subcellular distribution of endogenous GR and chicken Hsp90WT or Hsp90NLS. One hundred transfected 34i cells were analyzed by double immunofluorescence and confocal microscopy for GR (white bars) and Hsp90WT (hatched bars in a) or Hsp90NLS (black bars in b). Subcellular localizations (C = cytoplasmic, N = nuclear) were categorized as follows: C, C>N, C=N, N>C, and N.

