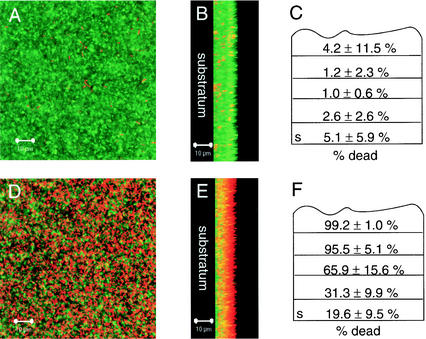
FIG. 6.
Cu-treated and untreated PAO1 biofilms grown in MSVP at 30°C. (A and B) Micrographs of an untreated biofilm. (A) Top down view; (B) saggital view with the substratum to the left. (D and E) Micrographs of a biofilm treated with 1 mM added Cu for 12 h. (D) Top down view; (E) saggital view with the substratum to the left. Dead cells were stained red with propidium iodide, while live cells were stained green with SYTO9 by using the BacLight LIVE/DEAD viability stain. The micrographs were taken with the SCLM by using a magnification of ×630. (C and F) Quantification of live and dead biomasses as determined by using COMSTAT to estimate the percentage of dead cells as a function of the total biomass within an untreated biofilm (C) and a biofilm treated with 1 mM added copper for 12 h (F). The substratum layer is indicated by s. Averages were calculated for 9 to 12 confocal image stacks for each condition and divided into fifths to normalize for variation in the image stack size. The average depth of the biofilms was 10 μm.

