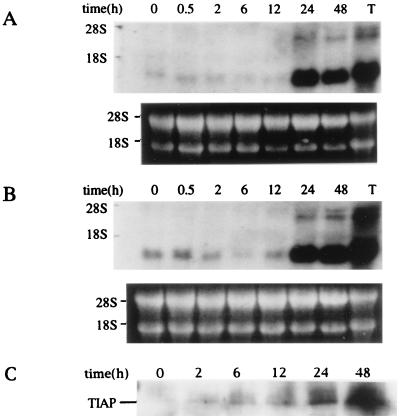
Figure 4.
Expression of Tiap mRNA in activated T cells. Splenocytes were stimulated with T cell-specific mitogen, anti-CD3 antibody (10 μg/ml) (A) or Con A (10 μg/ml) (B) and expression of Tiap mRNA as indicated was analyzed by Northern blot. RNA sample from thymus is indicated as T. (C) Western blot analysis of TIAP protein in splenocytes stimulated with Con A.

