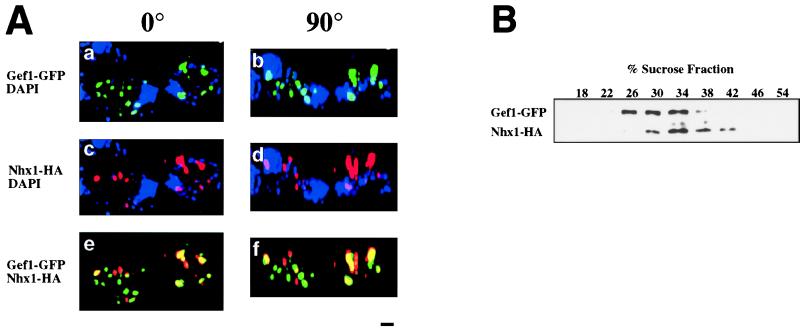
Figure 3.
Distribution of fluorescence and immunodetection of subcellular fractions in gef1 nhx1 cells transformed with two constructs: a GEF1-GFP fusion and a NHX1-(HA)3-tagged fusion. (A) The strain RGY419 (gef1 nhx1) was transformed with plasmids pRG151; GEF1-GFP and pRIN73; NHX1-(HA)3. Transformants were grown in SD (Difco; synthetic medium with 2% dextrose). When the cells reached OD600 = 0.5, hygromycin B (Sigma) was added to a final concentration of 0.1 mg/ml and the cells were incubated for 40 min at 30°C. Cells were fixed and stained with antibodies to HA epitope and 4′,6-diamidino-2-phenylindole (DAPI). Cells were viewed by charge-coupled device microscopy and optically sectioned by using a deconvolution algorithm (Scanalytics, Billerica, MA) (31). (Bar = 1 μm.) (a) Image obtained from Gef1-GFP fluorescence. (b) The same image rotated 90°. (c) Image obtained from the immunodetection of Nhx1-(HA)3. (d) The same image rotated 90°. (e) Image obtained from the superimposition of a and c. (f) Image obtained from the superimposition of b and d. 4′,6-Diamidino-2-phenylindole was omitted from images e and f. (B) The strain RGY419 (gef1 nhx1) transformed with plasmids pRG151; GEF1-GFP and pRIN73; NHX1-(HA)3 was grown in APG medium (12), converted to spheroplasts, lysed, and fractionated on a 10-step sucrose gradient (18–54%) as described (32, 33). Western blots show the distribution of Gef1-GFP and Nhx1-HA (see Materials and Methods).

