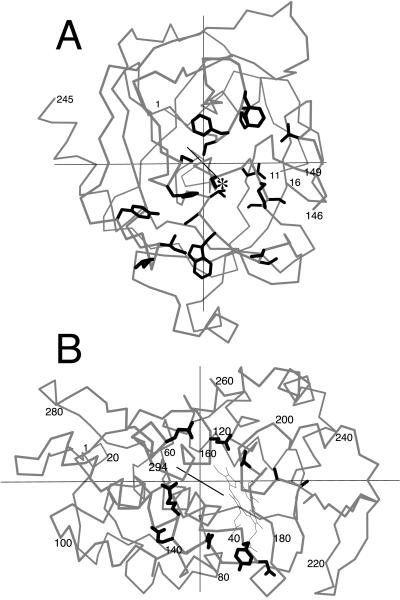
Figure 5.
Principal axes in protein–protein complexes. A. Bovine chymotrypsin from the complex with bovine pancreatic trypsin inhibitor (PDB 1cbw). An α-carbon trace is shown in gray. Side chains of residues that contact the ligand are drawn with heavy lines. Ser-195 is marked with an asterisk. (B) Yeast cytochrome c peroxidase from the complex with yeast iso-1 cytochrome c (PDB 2pcc), drawn as in A.

