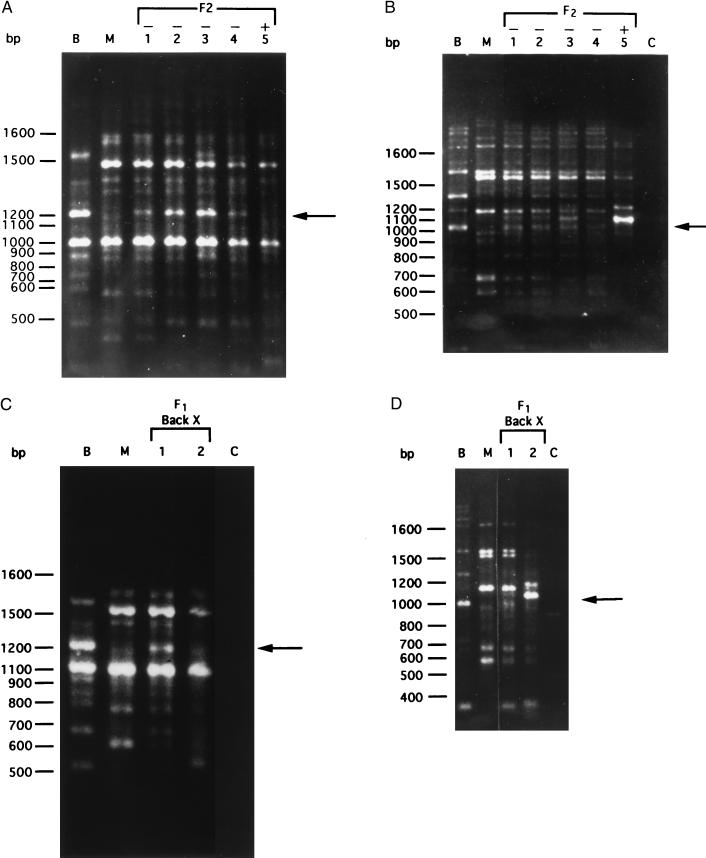
Figure 1.
(A) Primer OPM-04 RAPD products from genomic DNA of a resistant BS-90 parent (B), a susceptible M line parent (M), and four groups of resistant (1–4) and susceptible (5) F2 progeny. Arrow indicates the position of a 1.2-kb band in the resistant parent and offspring DNA. (B) Primer 0PZ-11 RAPD bands amplified from genomic DNA of resistant BS-90 (B), susceptible M line parents (M), and four groups of resistant (1–4) and susceptible (5) F2 progeny. Lane C shows amplification in the absence of template DNA. Arrow indicates position of 1.0-kb marker in resistant parent and progeny DNA. (C) Primer 0PM-04 amplification of resistant parents (B), susceptible parents (M), and F1 backcross resistant (1) and susceptible (2) progeny. Lane C represents amplification in the absence of DNA. Note the position of a 1.2-kb band (arrow) amplified only in resistant parent and progeny. (D) Primer OPZ-11 amplification of resistant (B), susceptible (M) parents, and resistant (1) and susceptible (2) F1 backcross progeny. Lane C shows RAPD–PCR without DNA template. Arrow shows position of 1.0-kb marker amplified only in the resistant parent and progeny.

