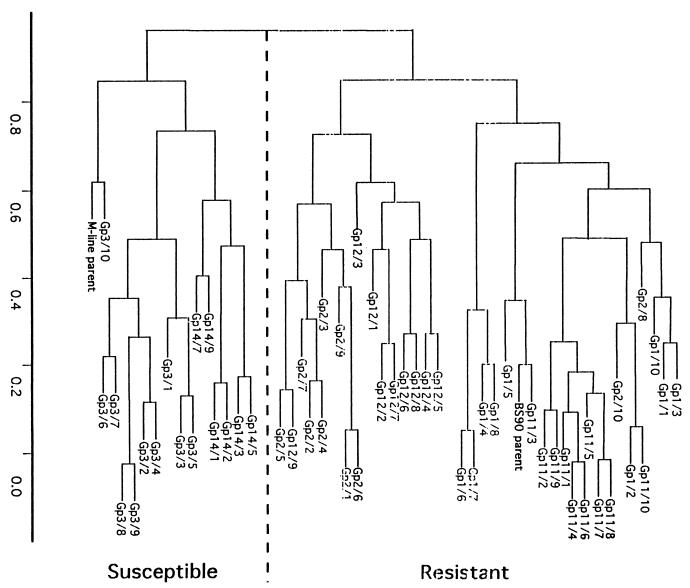
Figure 4.
Cluster analysis of the RAPD data was performed as described in Materials and Methods. A total of 30 bands from the 2 RAPD primers (OPM-04 and 0PZ-11) were scored for 56 individuals, including the parent snails and offspring in a blind fashion. The hierarchical cluster analysis was performed with a binary distance matrix calculated from the data with a cluster analysis program that works with s-plus 4.0. Those individuals to the right are all resistant to the disease, and conversely, those to the left of the dashed line are susceptible.

