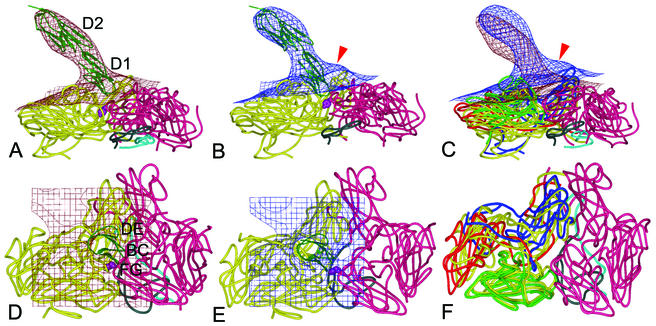
FIG. 5.
Virus-receptor binding surfaces. Side (top) and front (bottom) views of the fitted ICAM-1 and HRV3 crystal structures into the corresponding EM densities (grid) of the H3RC (A and D) and H3RH (B and E) complexes, superimposed in panels C and F. Density maps are contoured at 1.5 (top) and 2.0 (bottom) σ. A ribbon diagram of the two-domain crystal structure of ICAM-1 is shown, with the two interacting HRV3 protomers presented as worm drawings. The two connecting viral protomers are colored in yellow (left protomers in panels A, B, D, and E) and magenta (right protomers). In panels C and F, viral proteins VP1, VP2, and VP3 of H3RH are colored in blue, green, and red (the left protomer) or magenta (the right protomer), respectively; the superimposed H3RC protomer is colored in yellow. VP4 is cyan, and the N-terminal 60 residues of VP1 are gray. The red arrow points to the protruding density featuring the H3RH particle, predicted to be filled by the externalized VP4 and the VP1 N terminus. The side chain of the VP3 Tyr181 residue is indicated by purple spheres. The first (D1) and second (D2) domains of ICAM-1 are labeled, as are virus-binding BC, DE, and FG loops (6). The illustrations were prepared with the program PyMOL (http://www.pymol.org).

